Bottom homepage
Dirt
WTC & Hutch (JJ)
Erin & Field (erin)
Billiard Balls
Qui Tam Case
Why Indeed
Index Erin1 Erin2
Erin3
Erin4 Erin5 Erin6 Erin7 Erin8 Erin9 Erin10
Appendix_1 Appendix_2 Appendix_3


9/11 Weather Anomalies and Field Effects
(Appendix 2)

by

Judy Wood

This page last updated, May 19, 2008

click on images for enlargements.

This page is currently UNDER CONSTRUCTION.

(originally posted: March 25, 2008)


Forecast comparison (all values), Erin & Katrina

Casimir Force

Yxxxs)

Txxxe

Hxxxxs

Fxxxe

Pxxxys


Forecast comparison (all values), Erin & Katrina Top
MOVE TO APPENDIX2

Forecast Technique
Period (hours) for Hurricane Erin
12 24 36 48 72
CLIP 44 (40) 102 (36) 162 (32) 224 (28) 401 (24)
GFDI 32 (39) 53 (35) 71 (31) 87 (27) 169 (23)
LBAR 40 (40) 82 (36) 137 (32) 200 (28) 346 (24)
AVNI 31 (34) 53 (30) 71 (26) 87 (22) 165 (22)
BAMD 41 (40) 74 (36) 114 (32) 160 (28) 262 (24)
BAMM 36 (40) 67 (36) 90 (32) 102 (28) 191 (24)
BAMS 44 (40) 87 (36) 123 (32) 160 (28) 273 (24)
NGPI 40 (38) 65 (34) 100 (30) 119 (26) 219 (22)
UKMI 38 (37) 81 (33) 141 (29) 208 (25) 353 (22)
GUNS 28 (35) 50 (31) 74 (27) 96 (23) 193 (20)
NHC Official 32 (40) 60 (36) 80 (32) 96 (28) 183 (24)
NHC Official
(1991-2000 mean)
44 (2049) 82 (1835) 118 (1646) 151 (1475) 226 (1187)
*Output from these models was unavailable at time of forecast issuance.

Forecast Technique Forecast Period (hours) for Hurricane Katrina
12 24 36 48 72 96 120

CLP5

35 (27)

81 (25)

148 (23)

222 (21)

379 (17)

521 (13)

690 ( 9)

GFNI

27 (25)

45 (23)

59 (21)

73 (19)

149 (14) 194 (10) 196 ( 6)

GFDI

31 (27)

55 (25)

75 (23)

97 (21)

147 (17) 184 (13) 165 ( 9)

GFDL*

27 (26)

53 (25)

72 (23)

92 (21)

133 (17) 168 (13) 188 ( 9)

GFDN*

34 (24)

50 (24)

60 (22)

71 (20) 133 (15) 183 (11) 193 ( 7)

GFSI

27 (25)

49 (23)

75 (21)

104 (19)

191 (15)

331 (11)

493 ( 7)

GFSO*

26 (26)

43 (24)

71 (22)

94 (20) 165 (16)

290 (12)

489 ( 8)

AEMI

27 (25)

46 (23)

67 (21)

91 (19) 152 (15)

254 (11)

367 ( 7)

NGPI

27 (27)

48 (25)

72 (23)

96 (21)

161 (17) 194 (13)

242 ( 9)

NGPS*

34 (26)

54 (24)

80 (22)

96 (20)

143 (16) 179 (12)

203 ( 8)

UKMI

21 (23)

33 (22)

53 (21) 85 (19) 154 (15)

263 (11)

380 ( 7)

UKM*

28 (13)

28 (12)

40 (11) 67 (10) 128 ( 8)

208 ( 6)

324 ( 4)

A98E

33 (27)

58 (25)

81 (23)

126 (21)

238 (17)

346 (13)

411 ( 9)

A9UK

32 (13)

63 (12)

96 (11)

129 (10)

209 ( 8)

BAMD

26 (27)

45 (25)

65 (23)

86 (21)

111 (17)

197 (13)

326 ( 9)

BAMM

31 (27)

61 (25)

86 (23)

108 (21)

143 (17)

229 (13)

398 ( 9)

BAMS

59 (25)

109 (23)

138 (21)

158 (19)

185 (16)

255 (12)

408 ( 9)

CONU

21 (27)

37 (25) 54 (23) 78 (21) 148 (17)

196 (13)

260 ( 9)

GUNA

21 (23)

38 (22) 57 (21) 84 (19) 156 (15)

229 (11)

307 ( 7)

FSSE

21 (22)

38 (22) 61 (20) 95 (18) 160 (14)

221 (10)

253 ( 6)

OFCL

24 (27)

42 (25)

64 (23)

96 (21)

174 (17)

213 (13)

234 ( 9)

NHC Official (1995-2004 mean) 42 (3400) 75 (3116) 107 (2848) 138 (2575) 202 (2117) 236 (649) 310 (535)

Source: (doc)(pdf)
Table 3: Preliminary forecast evaluation (heterogeneous sample) for Hurricane Erin, 1-15 September 2001. Forecast errors for tropical storm and hurricane stages (n mi) are followed by the number of forecasts in parentheses. Errors smaller than the NHC official forecast are shown in bold-face type.
Source:


Best track positions for Hurricane Erin, September 2001.

Best track positions for Hurricane Erin, September 2001.
(Original figure from source.)
Figure 1: Best track for Hurricane Erin, September 2001. Track during the extratropical stage is based on analyses from the NOAA Marine Prediction Center.
Source:
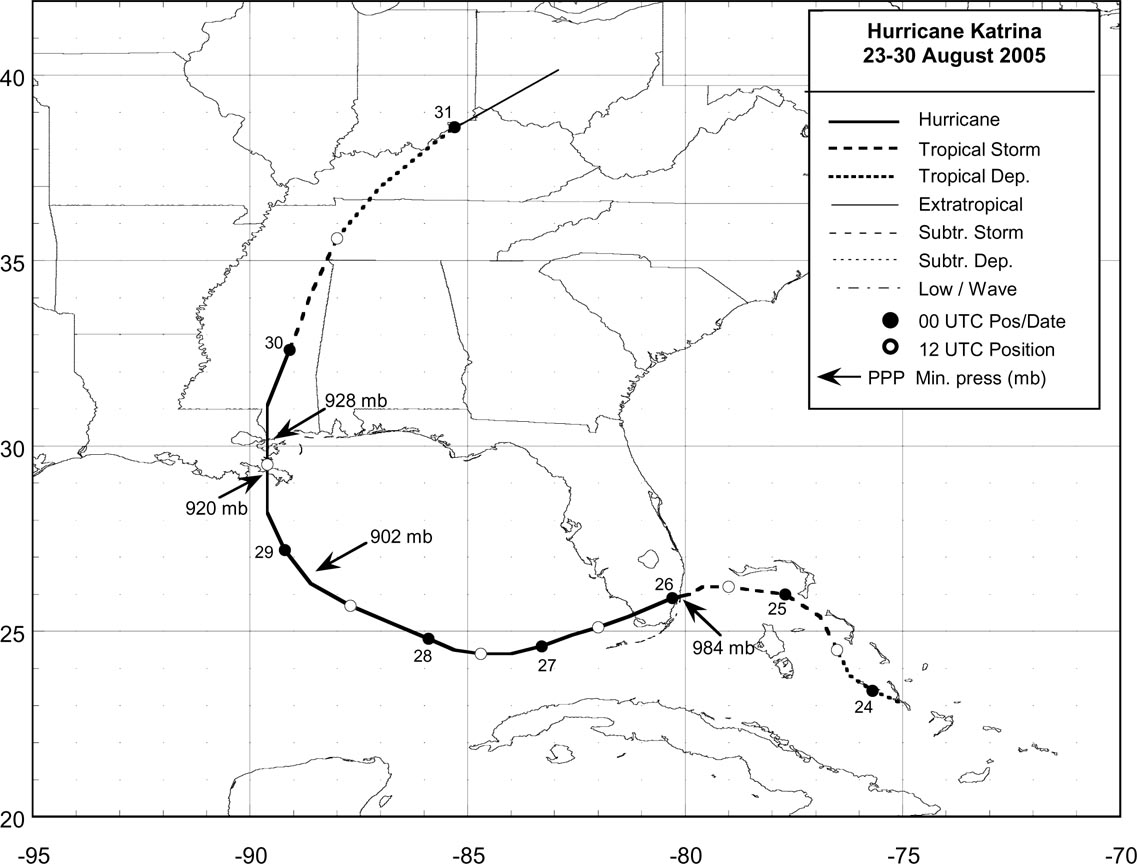
Figure 1x: Best track for Hurricane Katrina, August 2005. Track during the extratropical stage is based on analyses from the NOAA Marine Prediction Center.
Source: Katrina_p37_75.jpg, Katrina_p37_150.jpg, Katrina_p37_300.jpg
http://www.nhc.noaa.gov/pdf/TCR-AL122005_Katrina.pdf


click on images for enlargements.


Best track maximum sustained surface wind speed curve for Hurricane Erin

Best track maximum sustained surface wind speed curve for Hurricane Erin
(Original figure from source.)
Figure 2: Best track maximum sustained surface wind speed curve for Hurricane Erin, September 2001, and the observations on which the best track curve is based. Aircraft observations have been adjusted for elevation using 90%, 80%, and 80% reduction factors for observations from 700 mb, 850 mb, and 1500 ft, respectively. Dropwindsonde observations include actual 10 m winds (sfc), as well as surface estimates derived from the mean wind over the lowest 150 m of the wind sounding (LLM), and from the sounding boundary layer mean (MBL). Estimates during the extratropical stage are based on analyses from the NOAA Marine Prediction Center.
Source:
Figure 2x: Best track maximum sustained surface wind speed curve for Hurricane Katrina, August 2005, and the observations on which the best track curve is based.

Source: TCR-AL122005_Katrina38_75.jpg, TCR-AL122005_Katrina38_150.jpg, TCR-AL122005_Katrina38_300.jpg
http://www.nhc.noaa.gov/pdf/TCR-AL122005_Katrina.pdf


Best track minimum central pressure curve for Hurricane Erin

Best track minimum central pressure curve for Hurricane Erin
(Original figure from source.)
Figure 3: Best track minimum central pressure curve for Hurricane Erin, September 2001, and the observations on which the best track curve are based. Estimates during the extratropical stage are based on analyses from the NOAA Marine Prediction Center.
Source:
Figure 3: Best track minimum central pressure curve for Hurricane Katrina, August 2005, and the observations on which the best track curve are based. Estimates during the extratropical stage are based on analyses from the NOAA Marine Prediction Center.
Source: TCR-AL122005_Katrina39_75.jpg, TCR-AL122005_Katrina39_150.jpg, TCR-AL122005_Katrina39_300.jpg


Casimir Force Top

Physicists have 'solved' mystery of levitation

By Roger Highfield, Science Editor
Last Updated: 1:41am BST 08/08/2007

Levitation has been elevated from being pure science fiction to science fact, according to a study reported today by physicists.

In theory the discovery could be used to levitate a person
(after 9/11/01) Source:
In earlier work the same team of theoretical physicists showed that invisibility cloaks are feasible.

Now, in another report that sounds like it comes out of the pages of a Harry Potter book, the University of St Andrews team has created an 'incredible levitation effects' by engineering the force of nature which normally causes objects to stick together.

Professor Ulf Leonhardt and Dr Thomas Philbin, from the University of St Andrews in Scotland, have worked out a way of reversing this pheneomenon, known as the Casimir force, so that it repels instead of attracts.

Their discovery could ultimately lead to frictionless micro-machines with moving parts that levitate But they say that, in principle at least, the same effect could be used to levitate bigger objects too, even a person.

The Casimir force is a consequence of quantum mechanics, the theory that describes the world of atoms and subatomic particles that is not only the most successful theory of physics but also the most baffling.

The force is due to neither electrical charge or gravity, for example, but the fluctuations in all-pervasive energy fields in the intervening empty space between the objects and is one reason atoms stick together, also explaining a "dry glue" effect that enables a gecko to walk across a ceiling.

Now, using a special lens of a kind that has already been built, Prof Ulf Leonhardt and Dr Thomas Philbin report in the New Journal of Physics they can engineer the Casimir force to repel, rather than attact.

Because the Casimir force causes problems for nanotechnologists, who are trying to build electrical circuits and tiny mechanical devices on silicon chips, among other things, the team believes the feat could initially be used to stop tiny objects from sticking to each other.

Prof Leonhardt explained,

"The Casimir force is the ultimate cause of friction in the n

ano-world, in particular in some microelectromechanical systems.

Such systems already play an important role - for example tiny mechanical devices which triggers a car airbag to inflate or those which power tiny 'lab on chip' devices used for drugs testing or chemical analysis.

Micro or nano machines could run smoother and with less or no friction at all if one can manipulate the force."


Though it is possible to levitate objects as big as humans, scientists are a long way off developing the technology for such feats, said Dr Philbin.

The practicalities of designing the lens to do this are daunting but not impossible and levitation "could happen over quite a distance".

Prof Leonhardt leads one of four teams - three of them in Britain - to have put forward a theory in a peer-reviewed journal to achieve invisibility by making light waves flow around an object - just as a river flows undisturbed around a smooth rock.

Figure 25. Physicists have 'solved' mystery of levitation
By Roger Highfield, Science Editor, 08/08/2007
(8/08/07) Source:


 Continue to next page.


 Continue to next page.


Top homepage
Dirt
WTC & Hutch (JJ)
Erin & Field (erin)
Billiard Balls
Qui Tam Case
Why Indeed
Index Erin1 Erin2
Erin3
Erin4 Erin5 Erin6 Erin7 Erin8 Erin9 Erin10
Appendix_1 Appendix_2 Appendix_3


In accordance with Title 17 U.S.C. Section 107, the articles posted on this webpage are distributed for their included information without profit for research and/or educational purposes only. This webpage has no affiliation whatsoever with the original sources of the articles nor are we sponsored or endorsed by any of the original sources.

© 2006-2008 Judy Wood and the author above. All rights reserved.