|
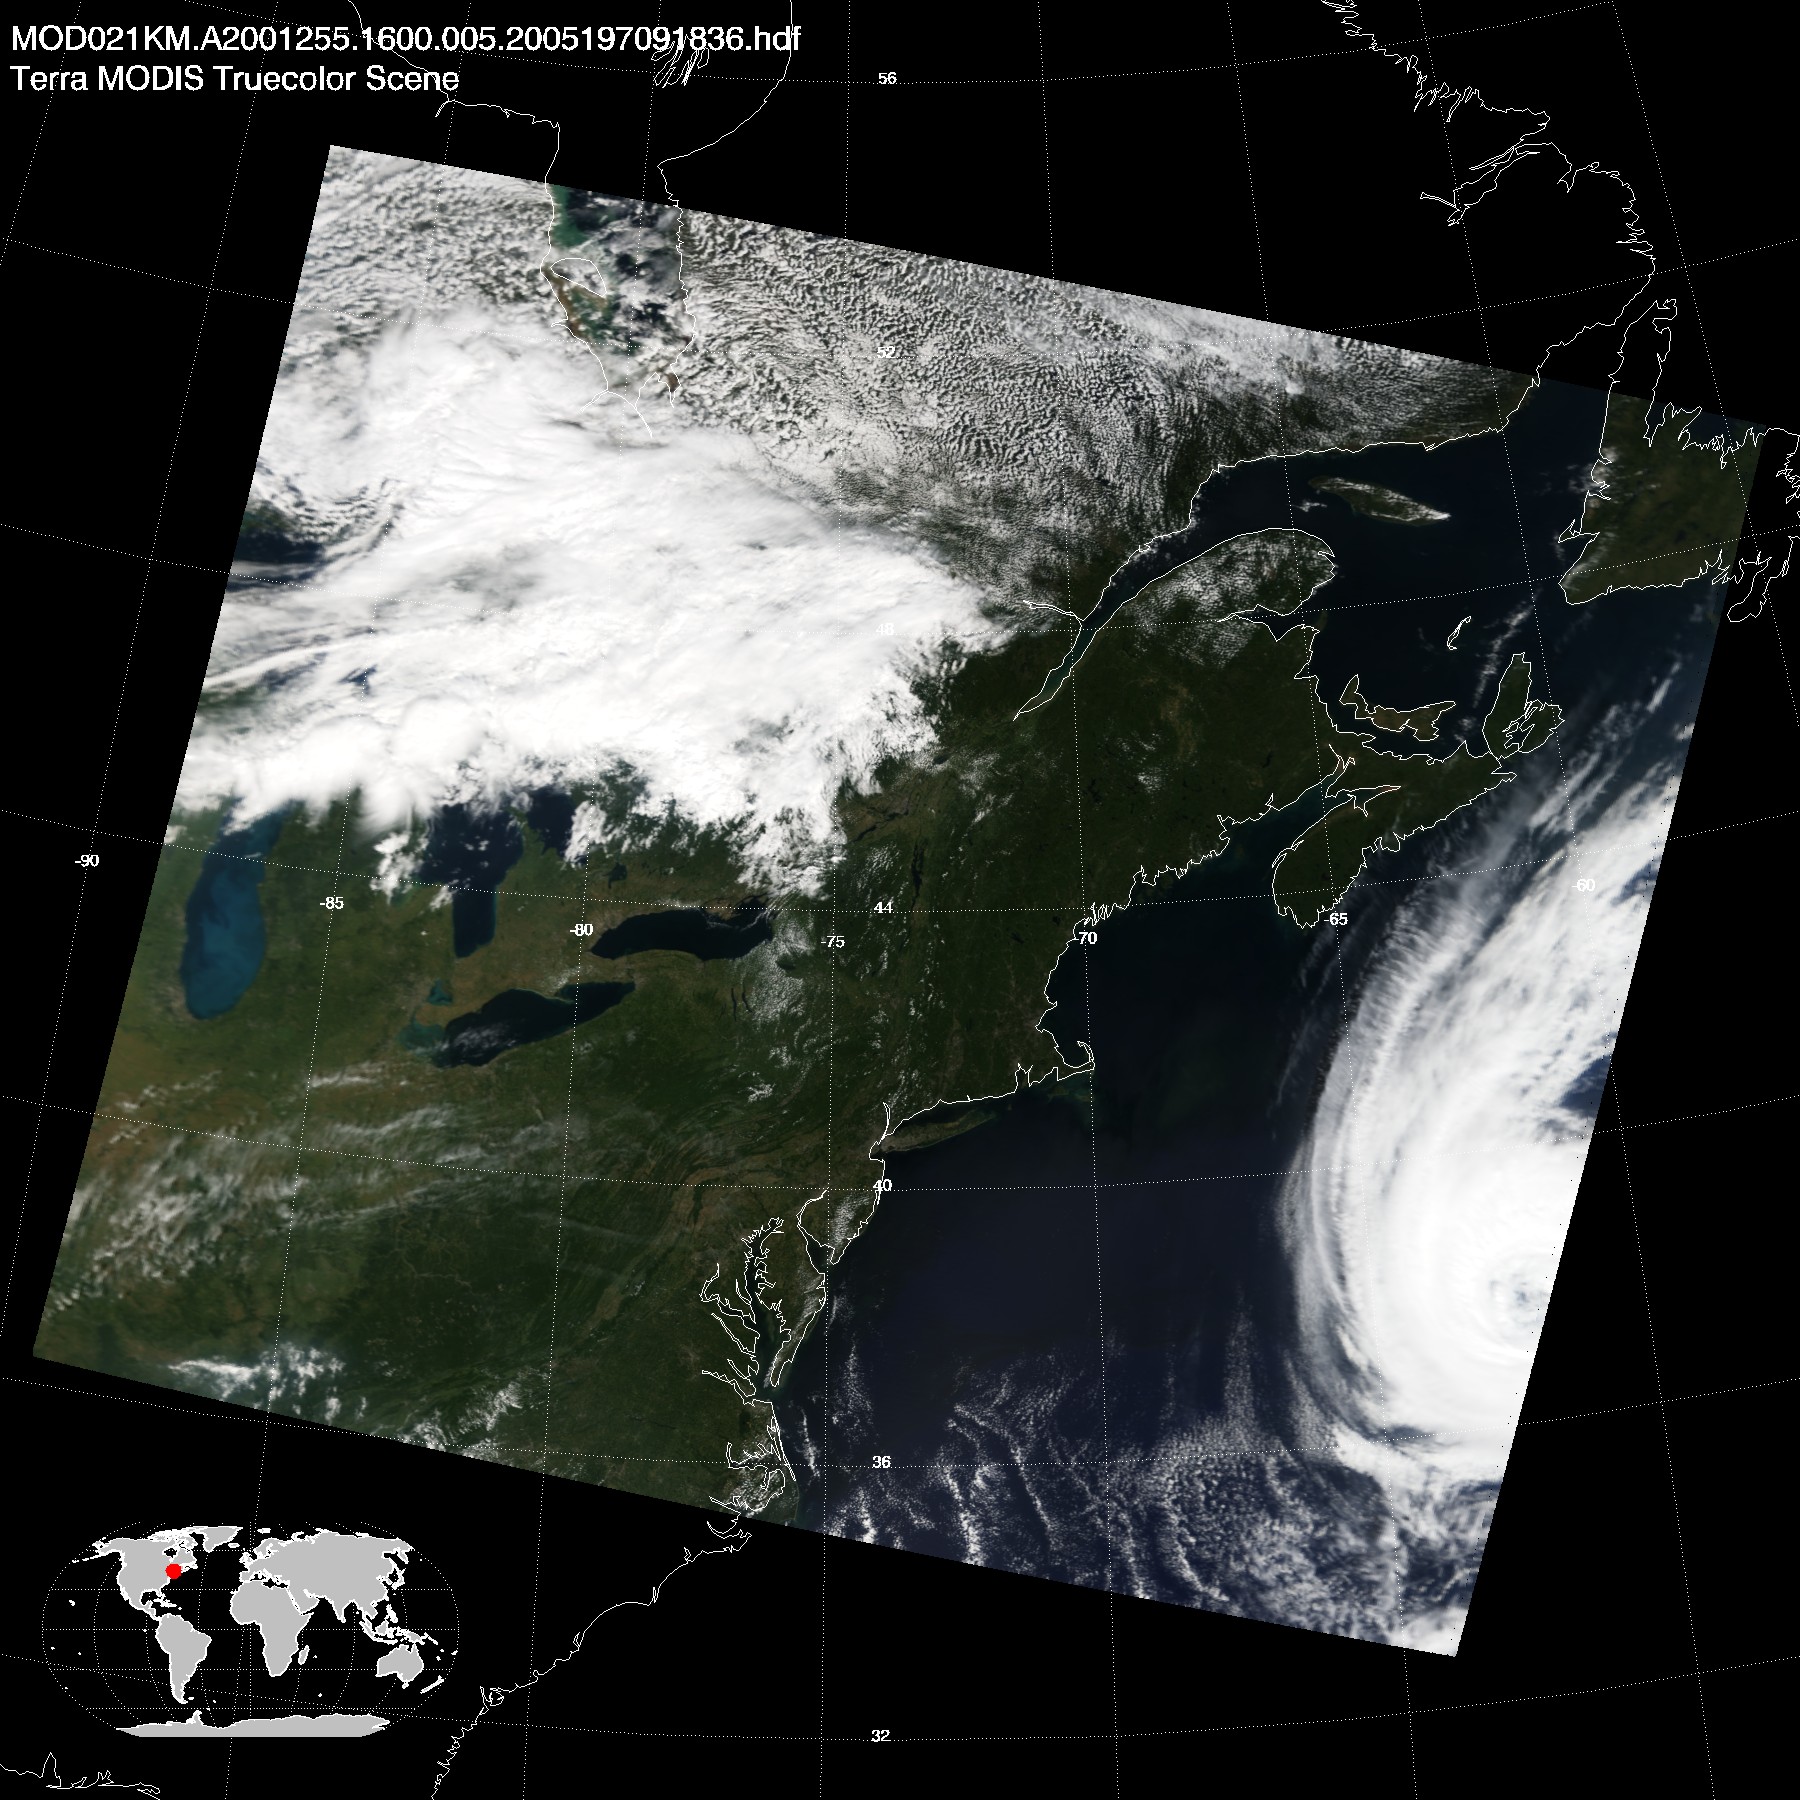
Hurricane Erin, September 11, 2001
|
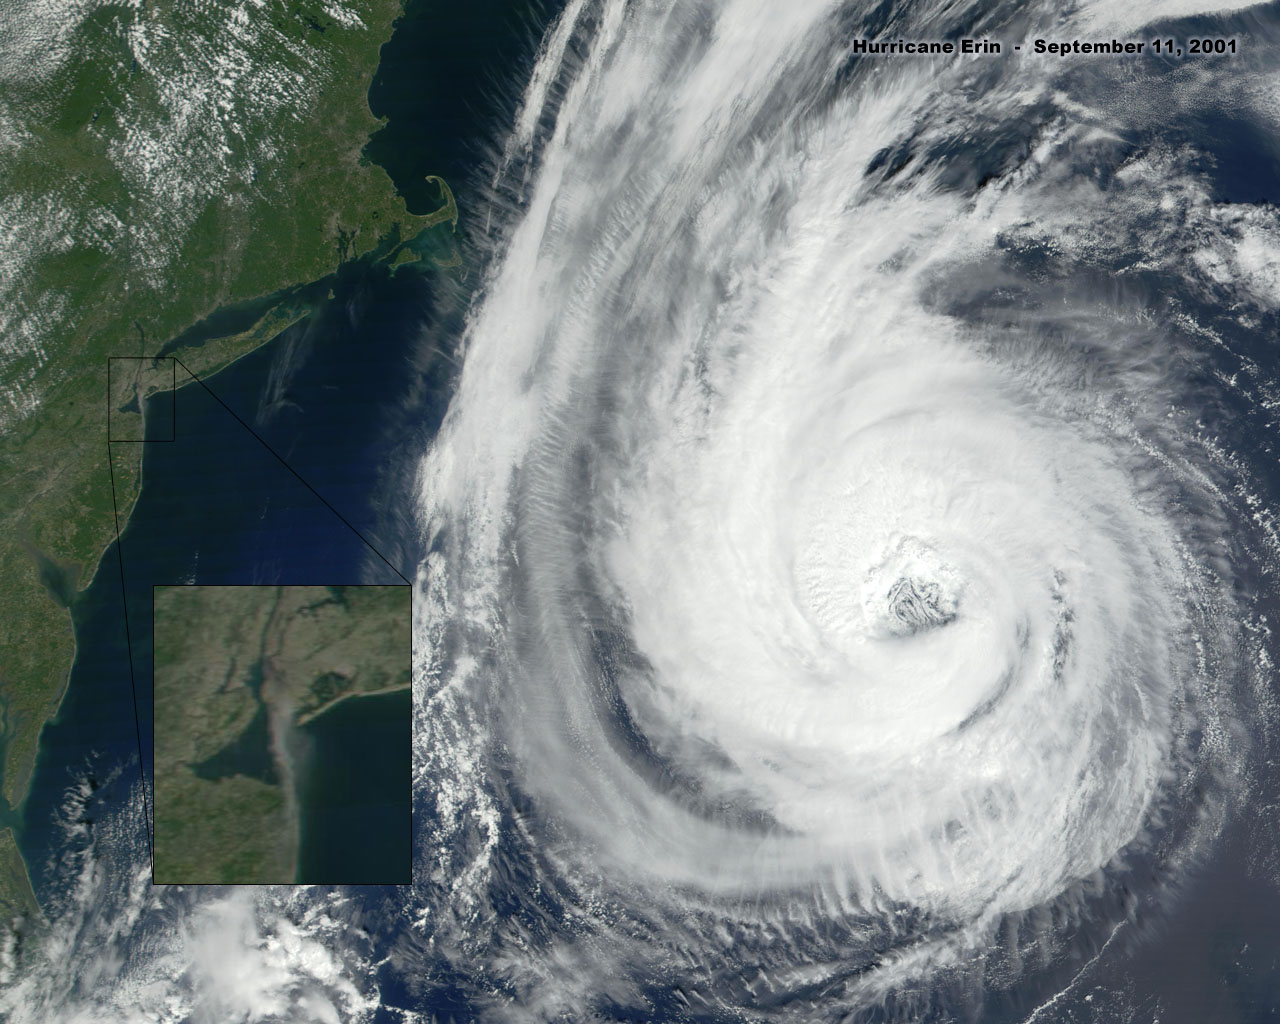 |
| Figure 1. Hurricane Erin on 9/11/01 (9/11/01) Source:, (9/11/01) Original Image: (more) |
| Bottom | homepage |
|
|
|
|
|
|
|
|
by
Judy Wood
This page last updated, May 19, 2008
|
click on images for enlargements.
|
This page is currently UNDER CONSTRUCTION.
|
Hurricane Erin, September 11, 2001
|
|
|
| Figure 1. Hurricane Erin on 9/11/01 (9/11/01) Source:, (9/11/01) Original Image: (more) |
| September 11, 2001 |
 |
| Figure 2. (9/11/01) Source: |
| September 11, 2001 |
September 11, 2001 |
 |
 |
| Figure 3. (9/11/01) Source: |
Figure 4. (9/11/01) Source: |
| September 11, 2001 |
September 11, 2001 |
 |
 |
| Figure 5. (9/11/01) Source: (original) |
Figure 6. (9/11/01) Source: (original) |
| September 11, 2001 |
September 11, 2001 |
 |
 |
| Figure 7. (9/11/01) Source: (original) |
Figure 8. (9/11/01) Source: (original) |
| September 11, 2001 |
|
 |
 |
| Figure 9. (9/11/01) Source: (original) |
Figure 10. (10/31/01) Source |
| September 12, 2001 (perhaps 9/11/01?) |
September 12, 2001 (perhaps 9/11/01?) |
 |
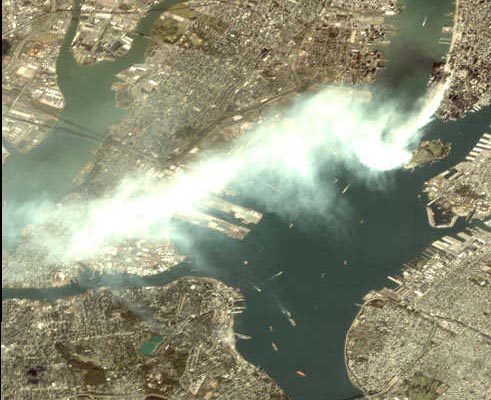 |
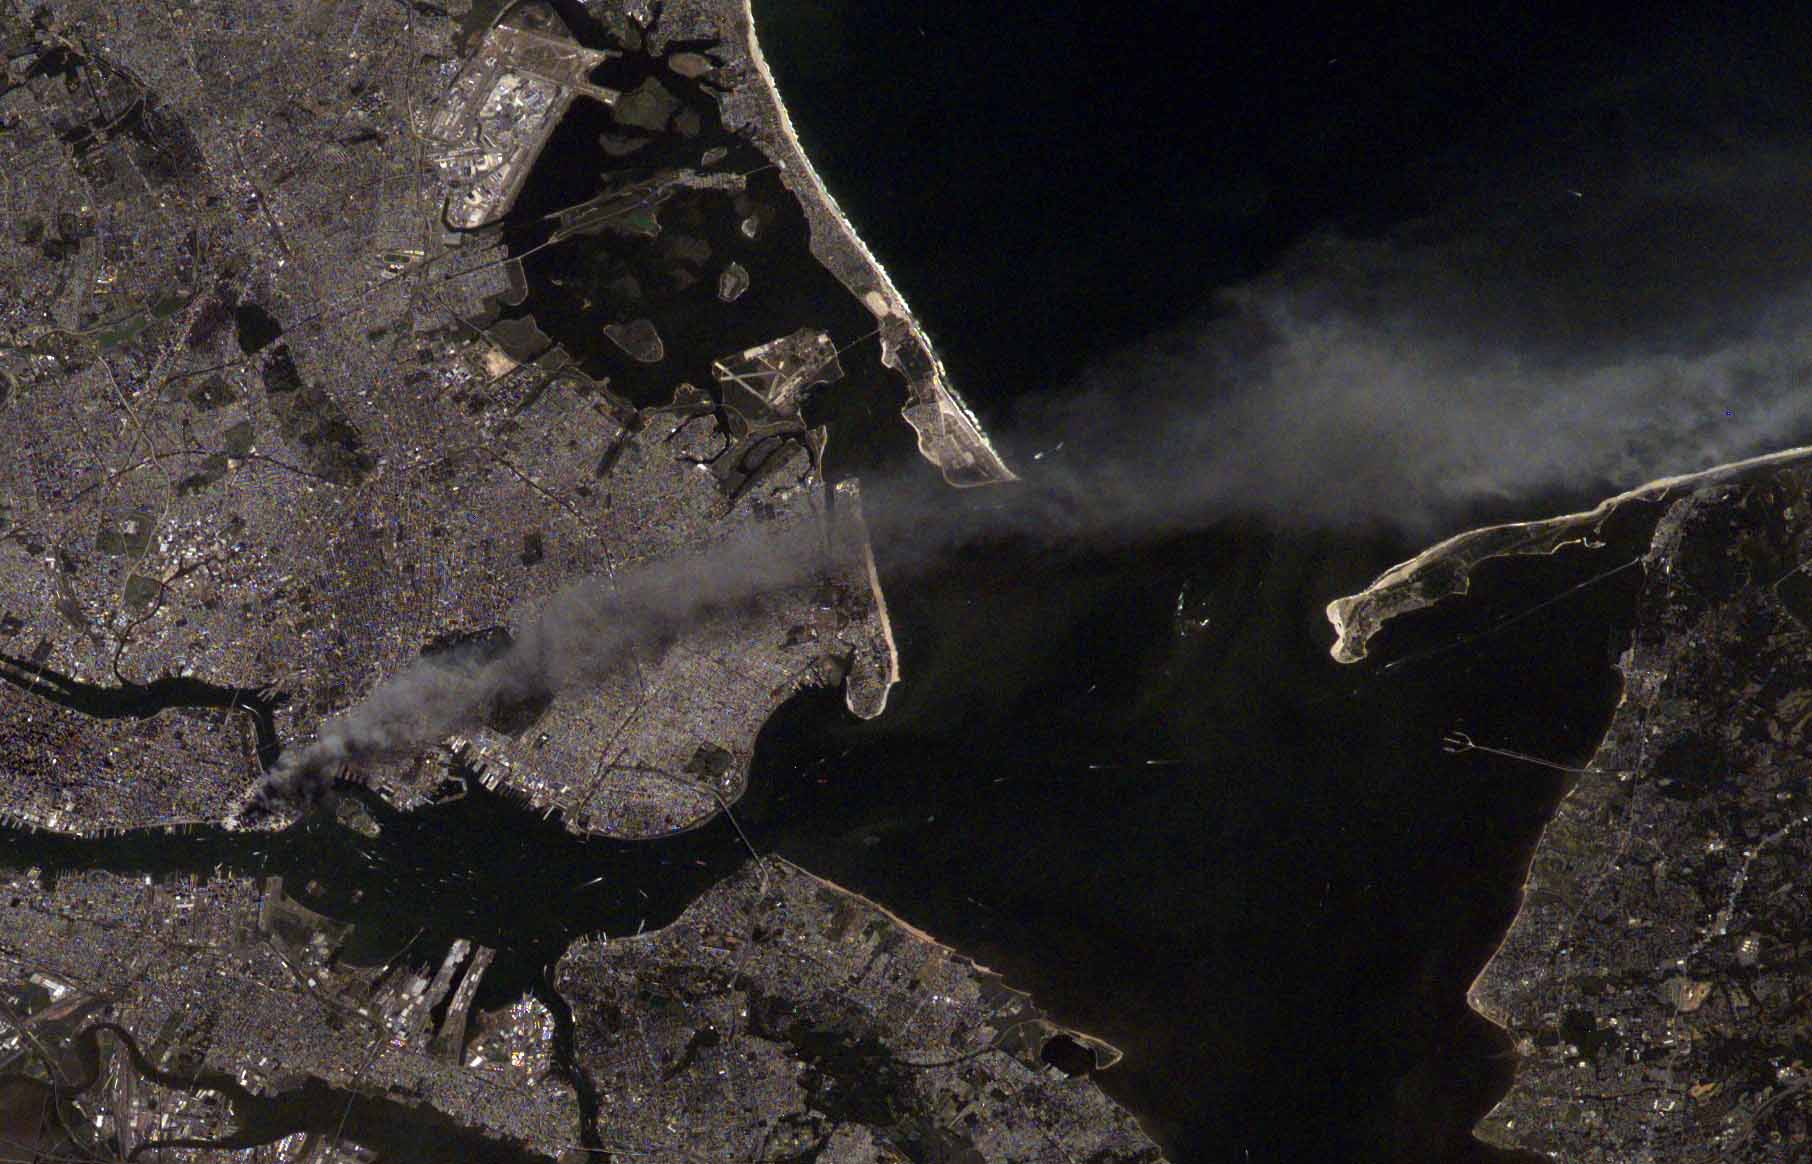
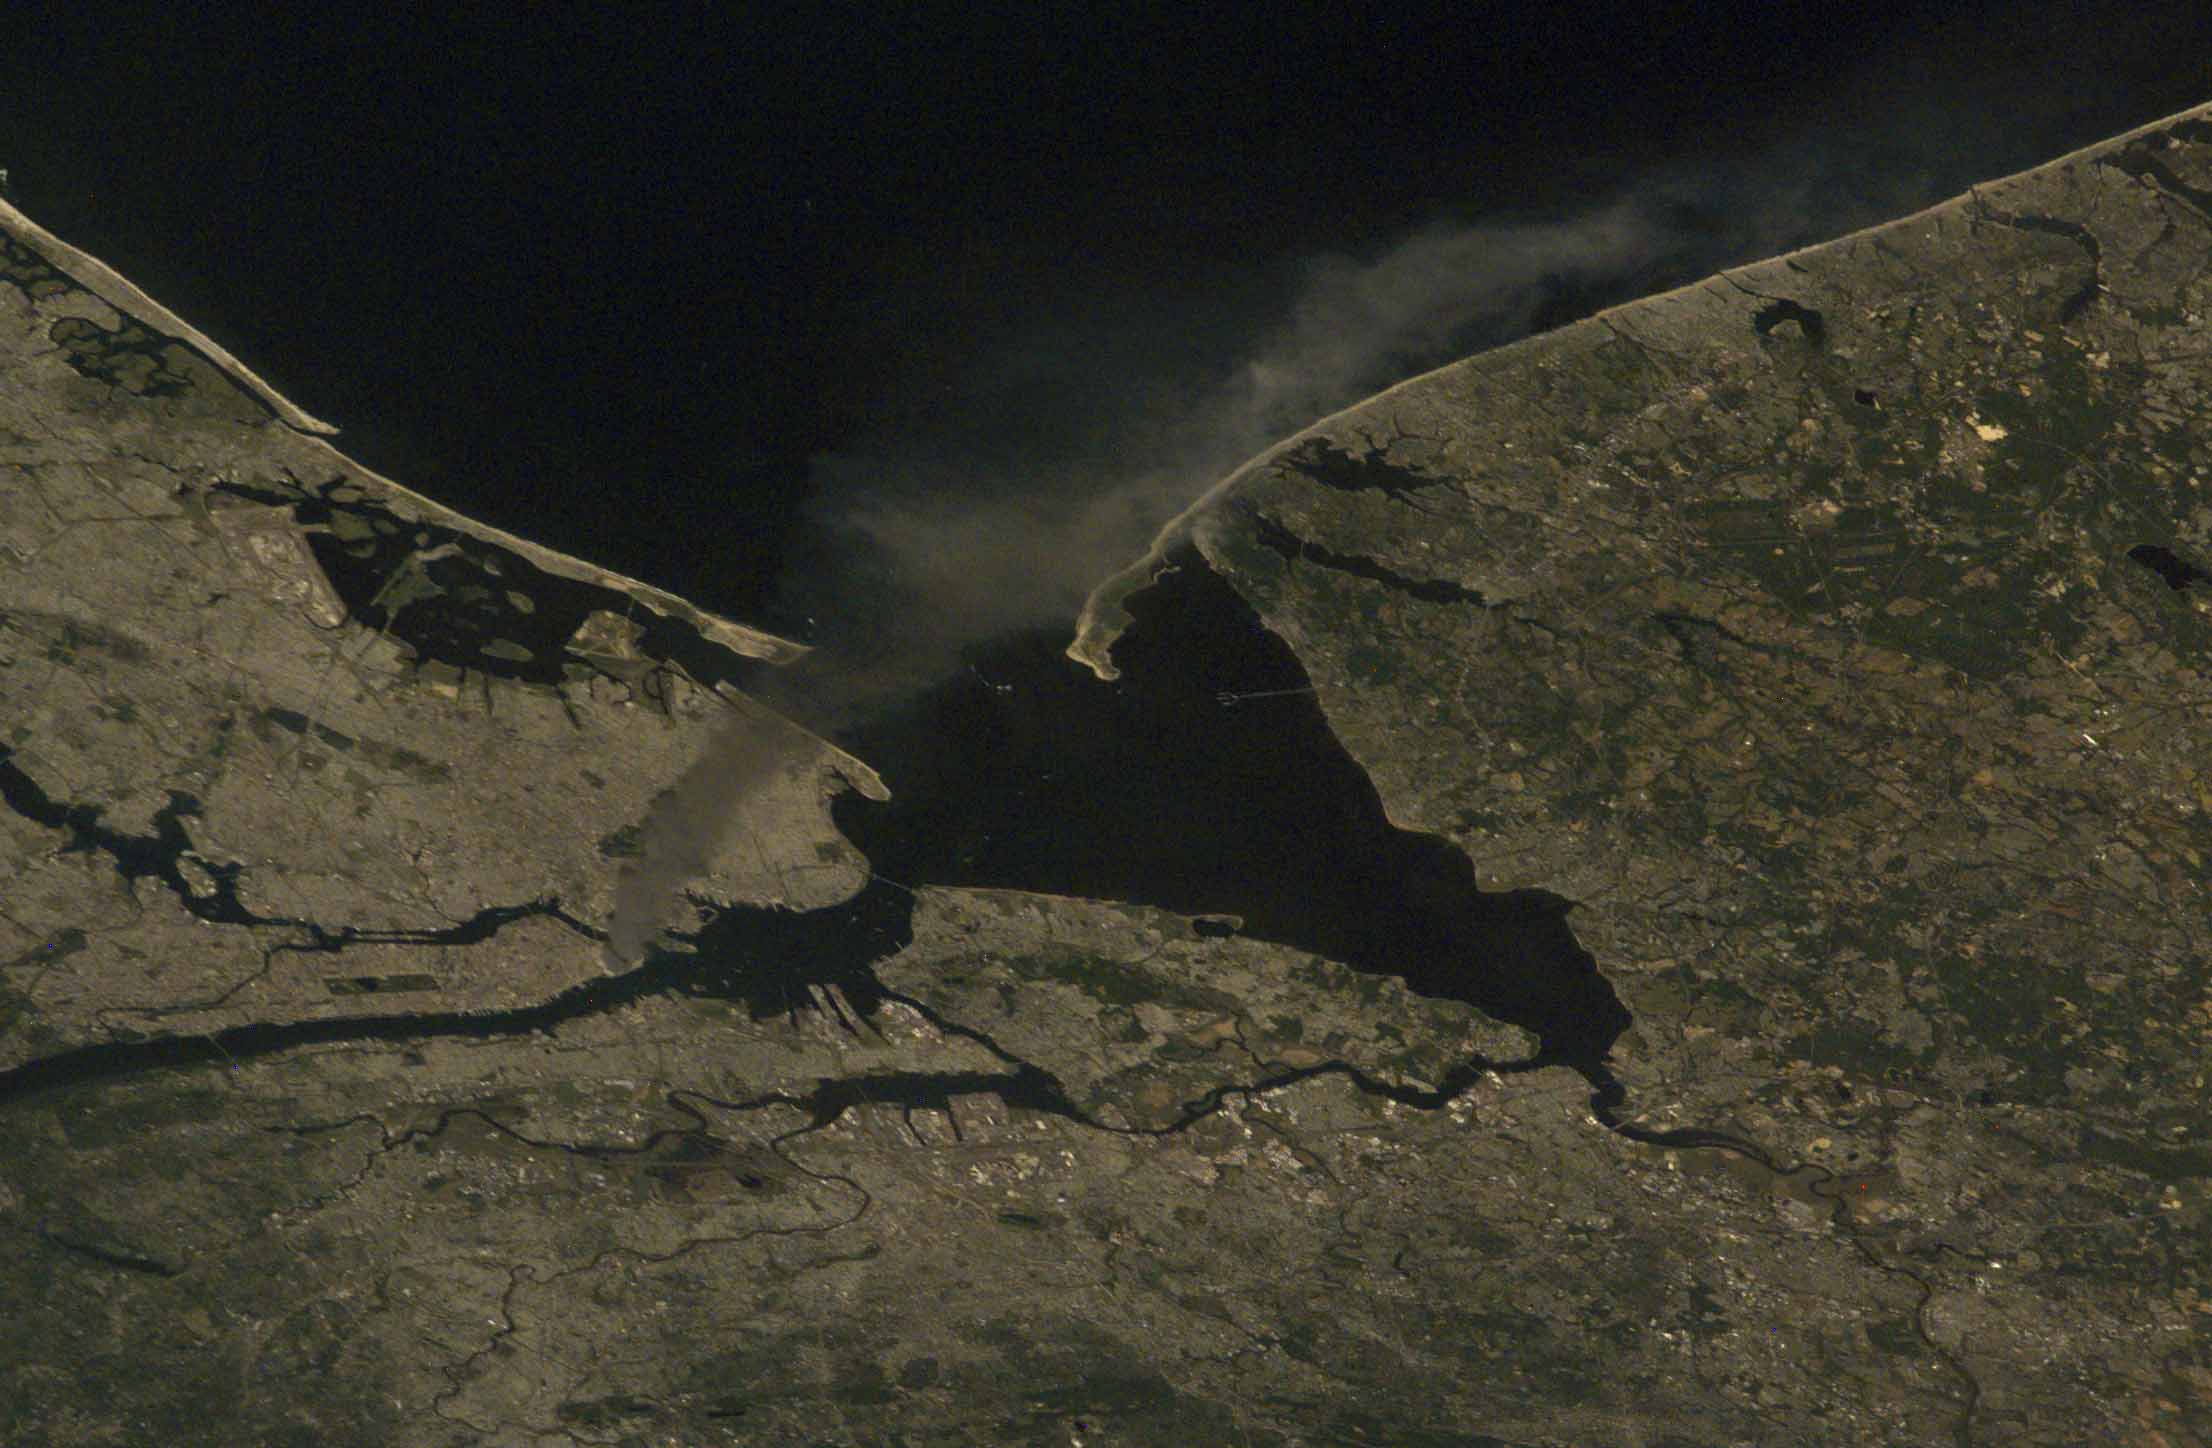
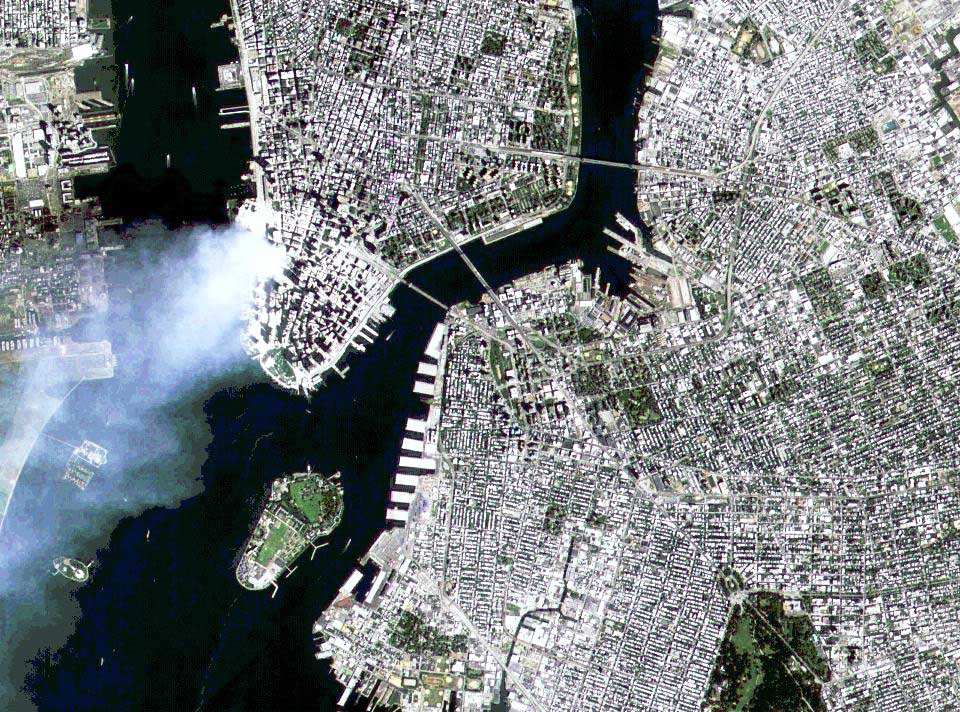
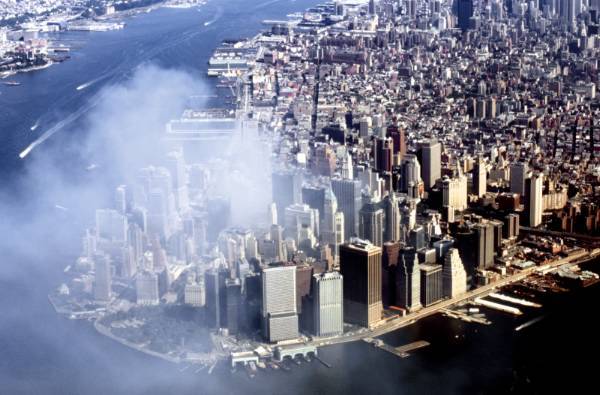
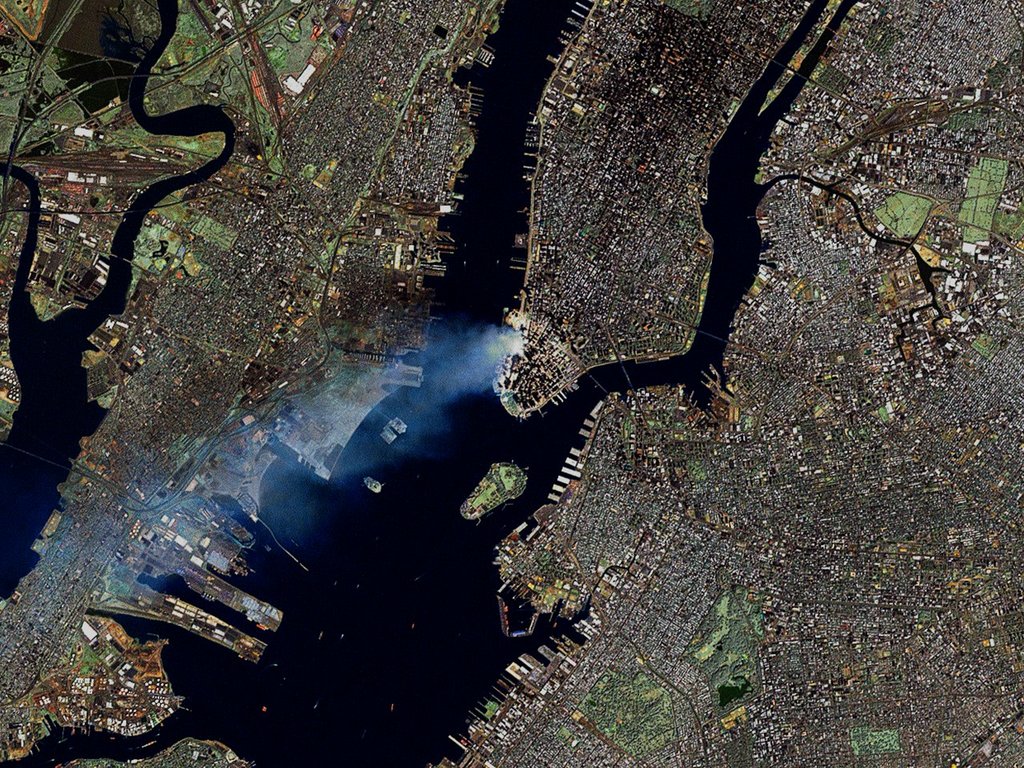
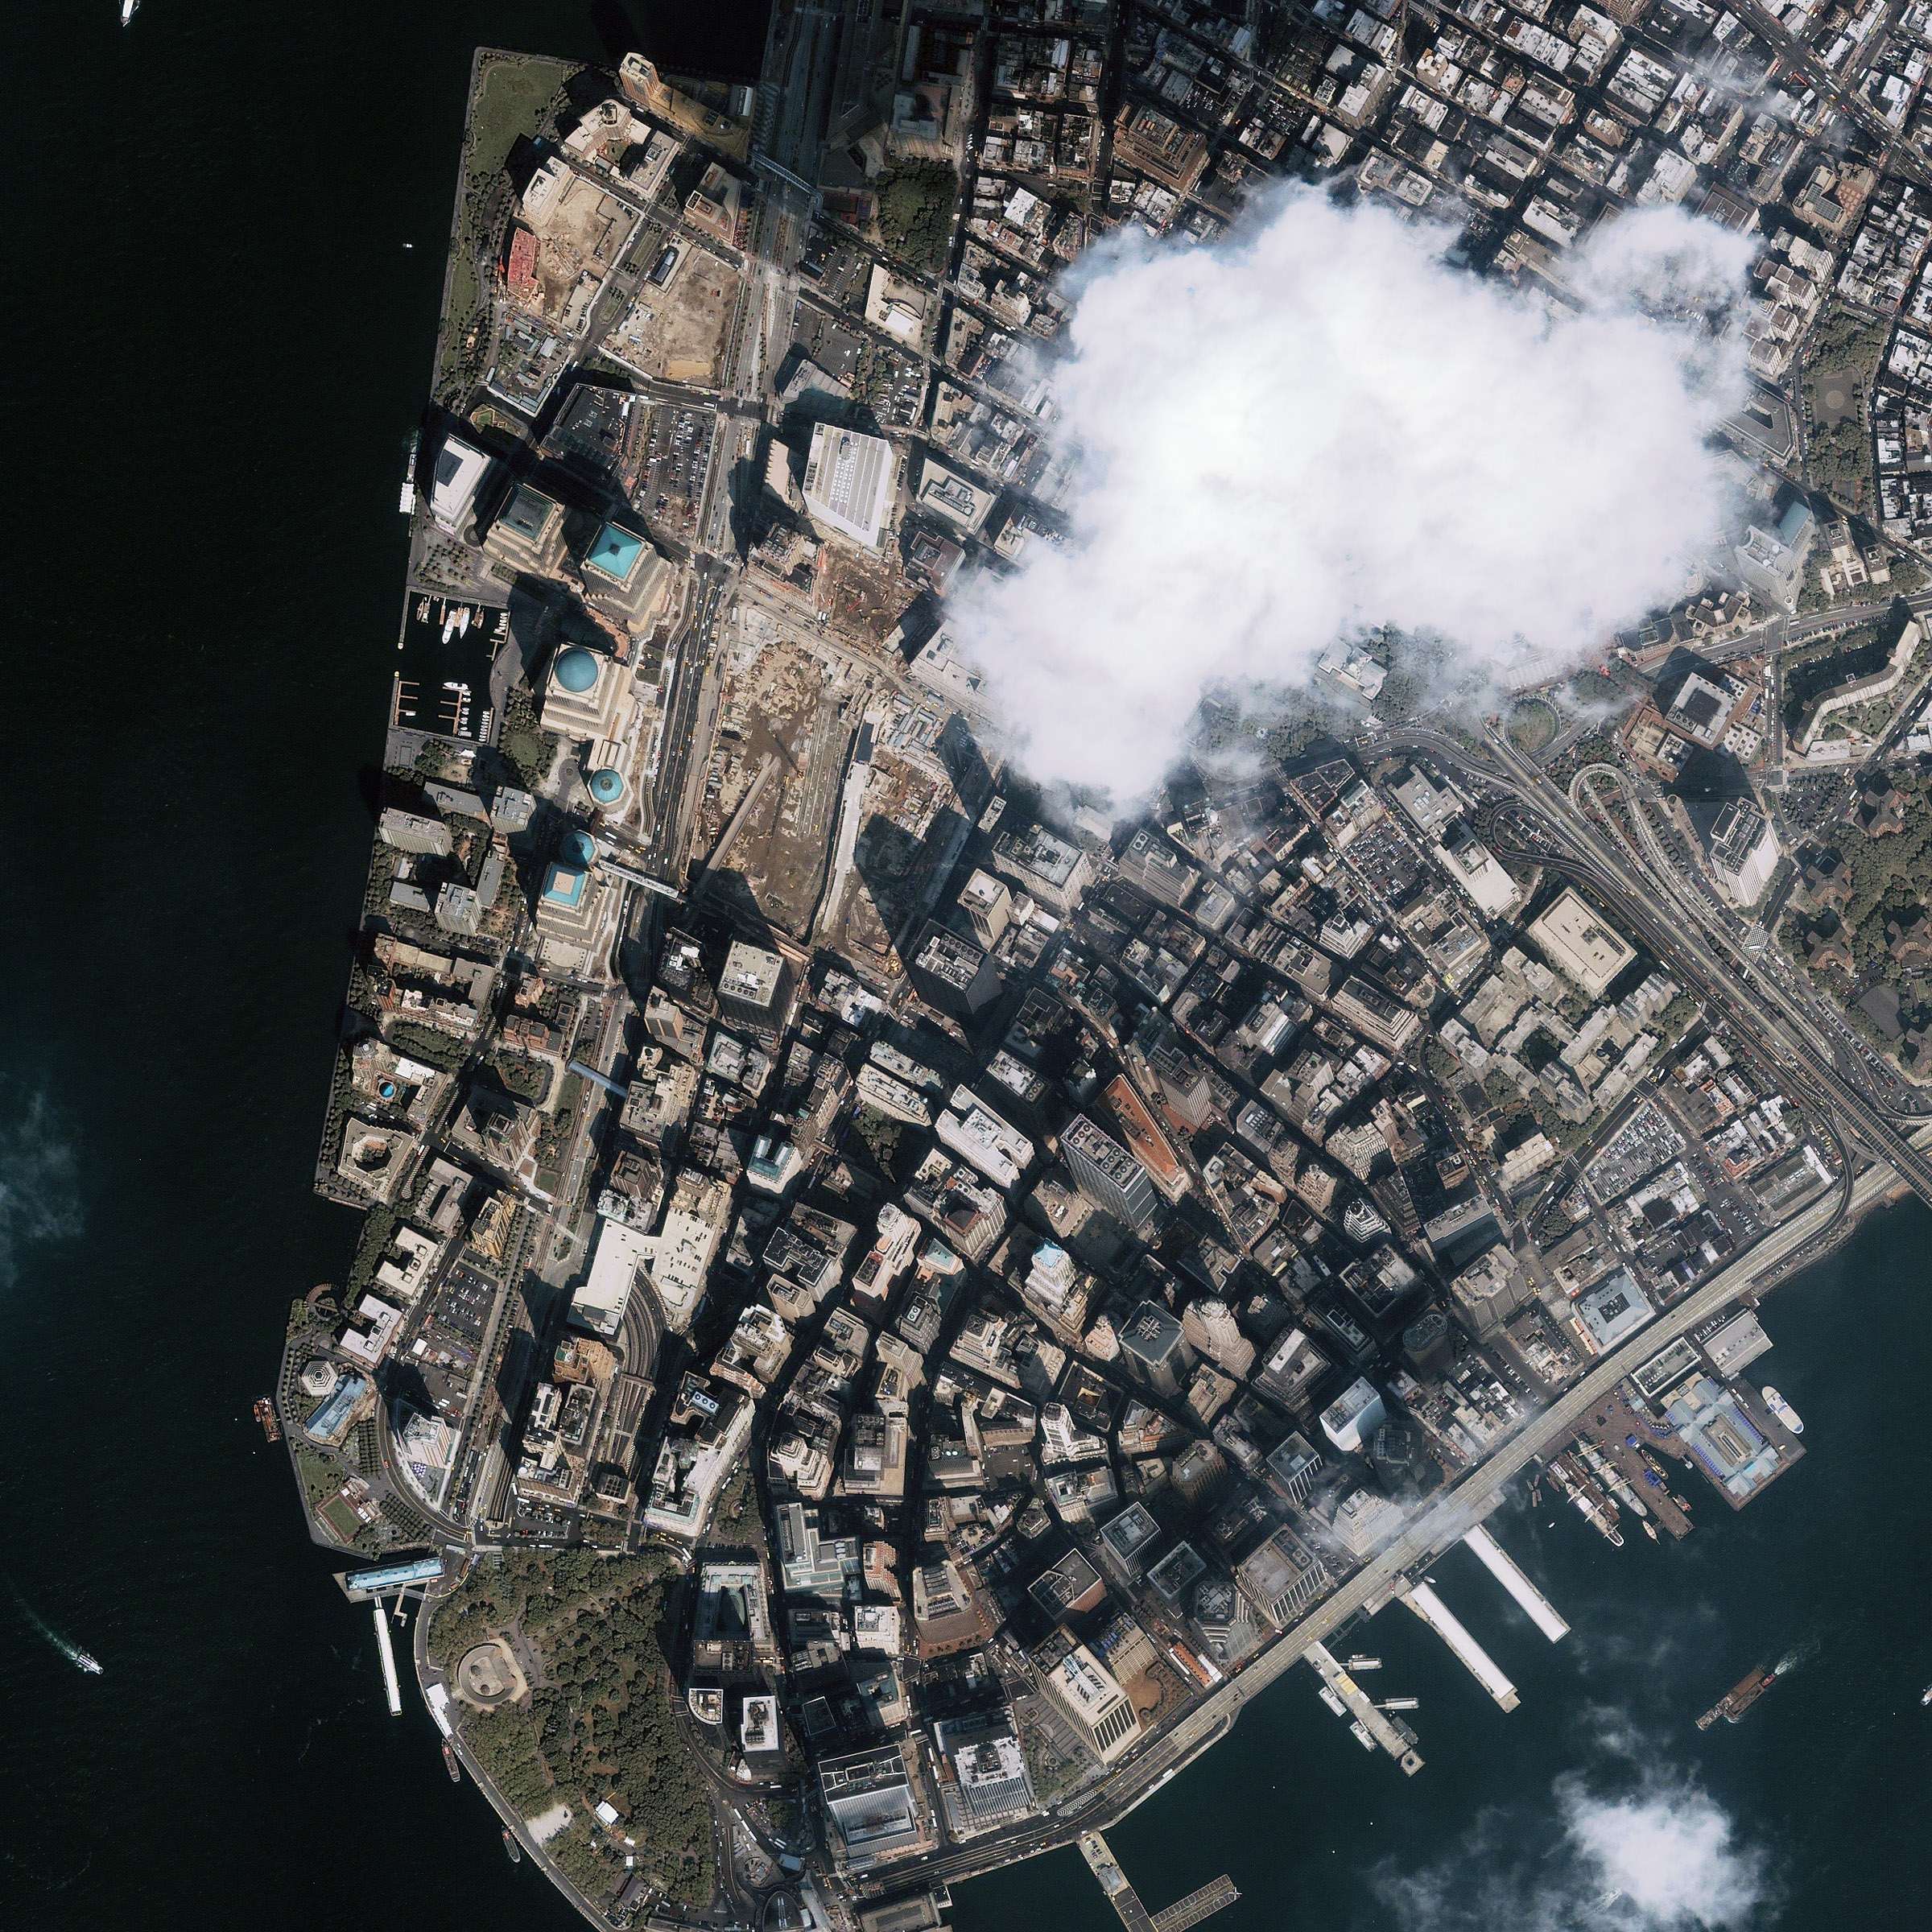
| Figure 11. This is a satellite image captured on 9/12/01. It appears that the cloud emerging from the WTC site stays together until it reaches a particular altitude where it begins to just disperse. There appears to be a kink in the cloud trail where this occurs. (9/12/01) Source: space imaging: |
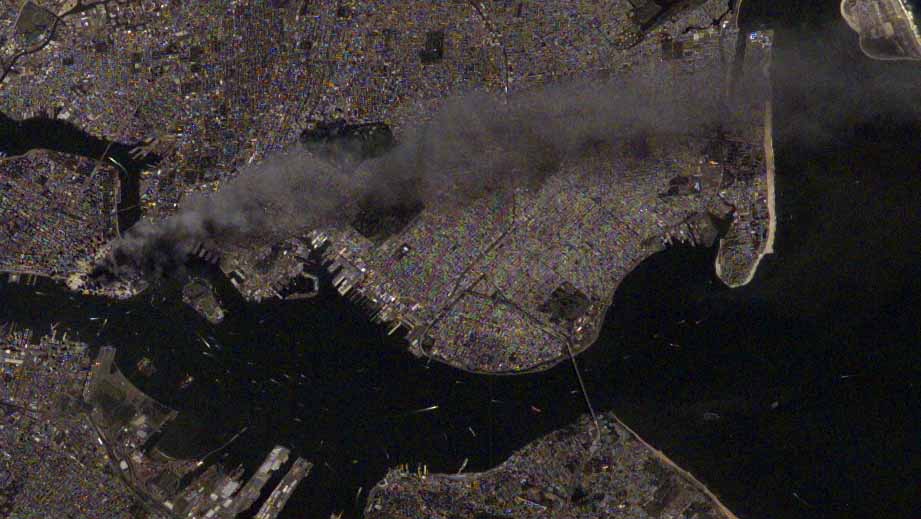
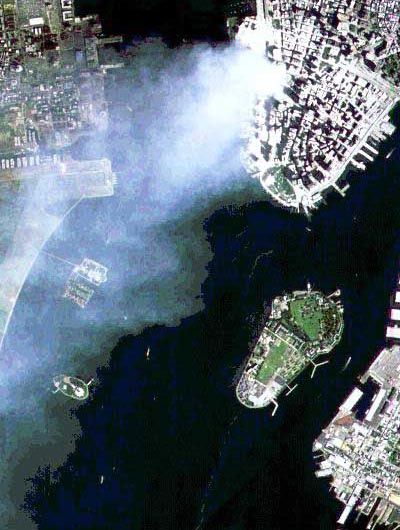
Figure 12. Lower-left portion of previous image. This image was posted with the date of 9/12/01. However, the dark plume just west (or above?) the WTC complex and the denseness of the white fuming implies this photo was more likely captured on 9/11/01. (9/12/01) Source: space imaging: |
| September 12, 2001 |
September 12, 2001 |
 |
 |
| Figure 13. (9/12/01) Source: |
Figure 14. (9/12/01) Source: |
 |
 |
| Figure 15. (11?/?/01) Source: |
Figure 16. Cotton Candy - mold. (10/31/01) Source: |
|
click on images for enlargements.
|
| September 12?, 2001 |
|
 |
 |
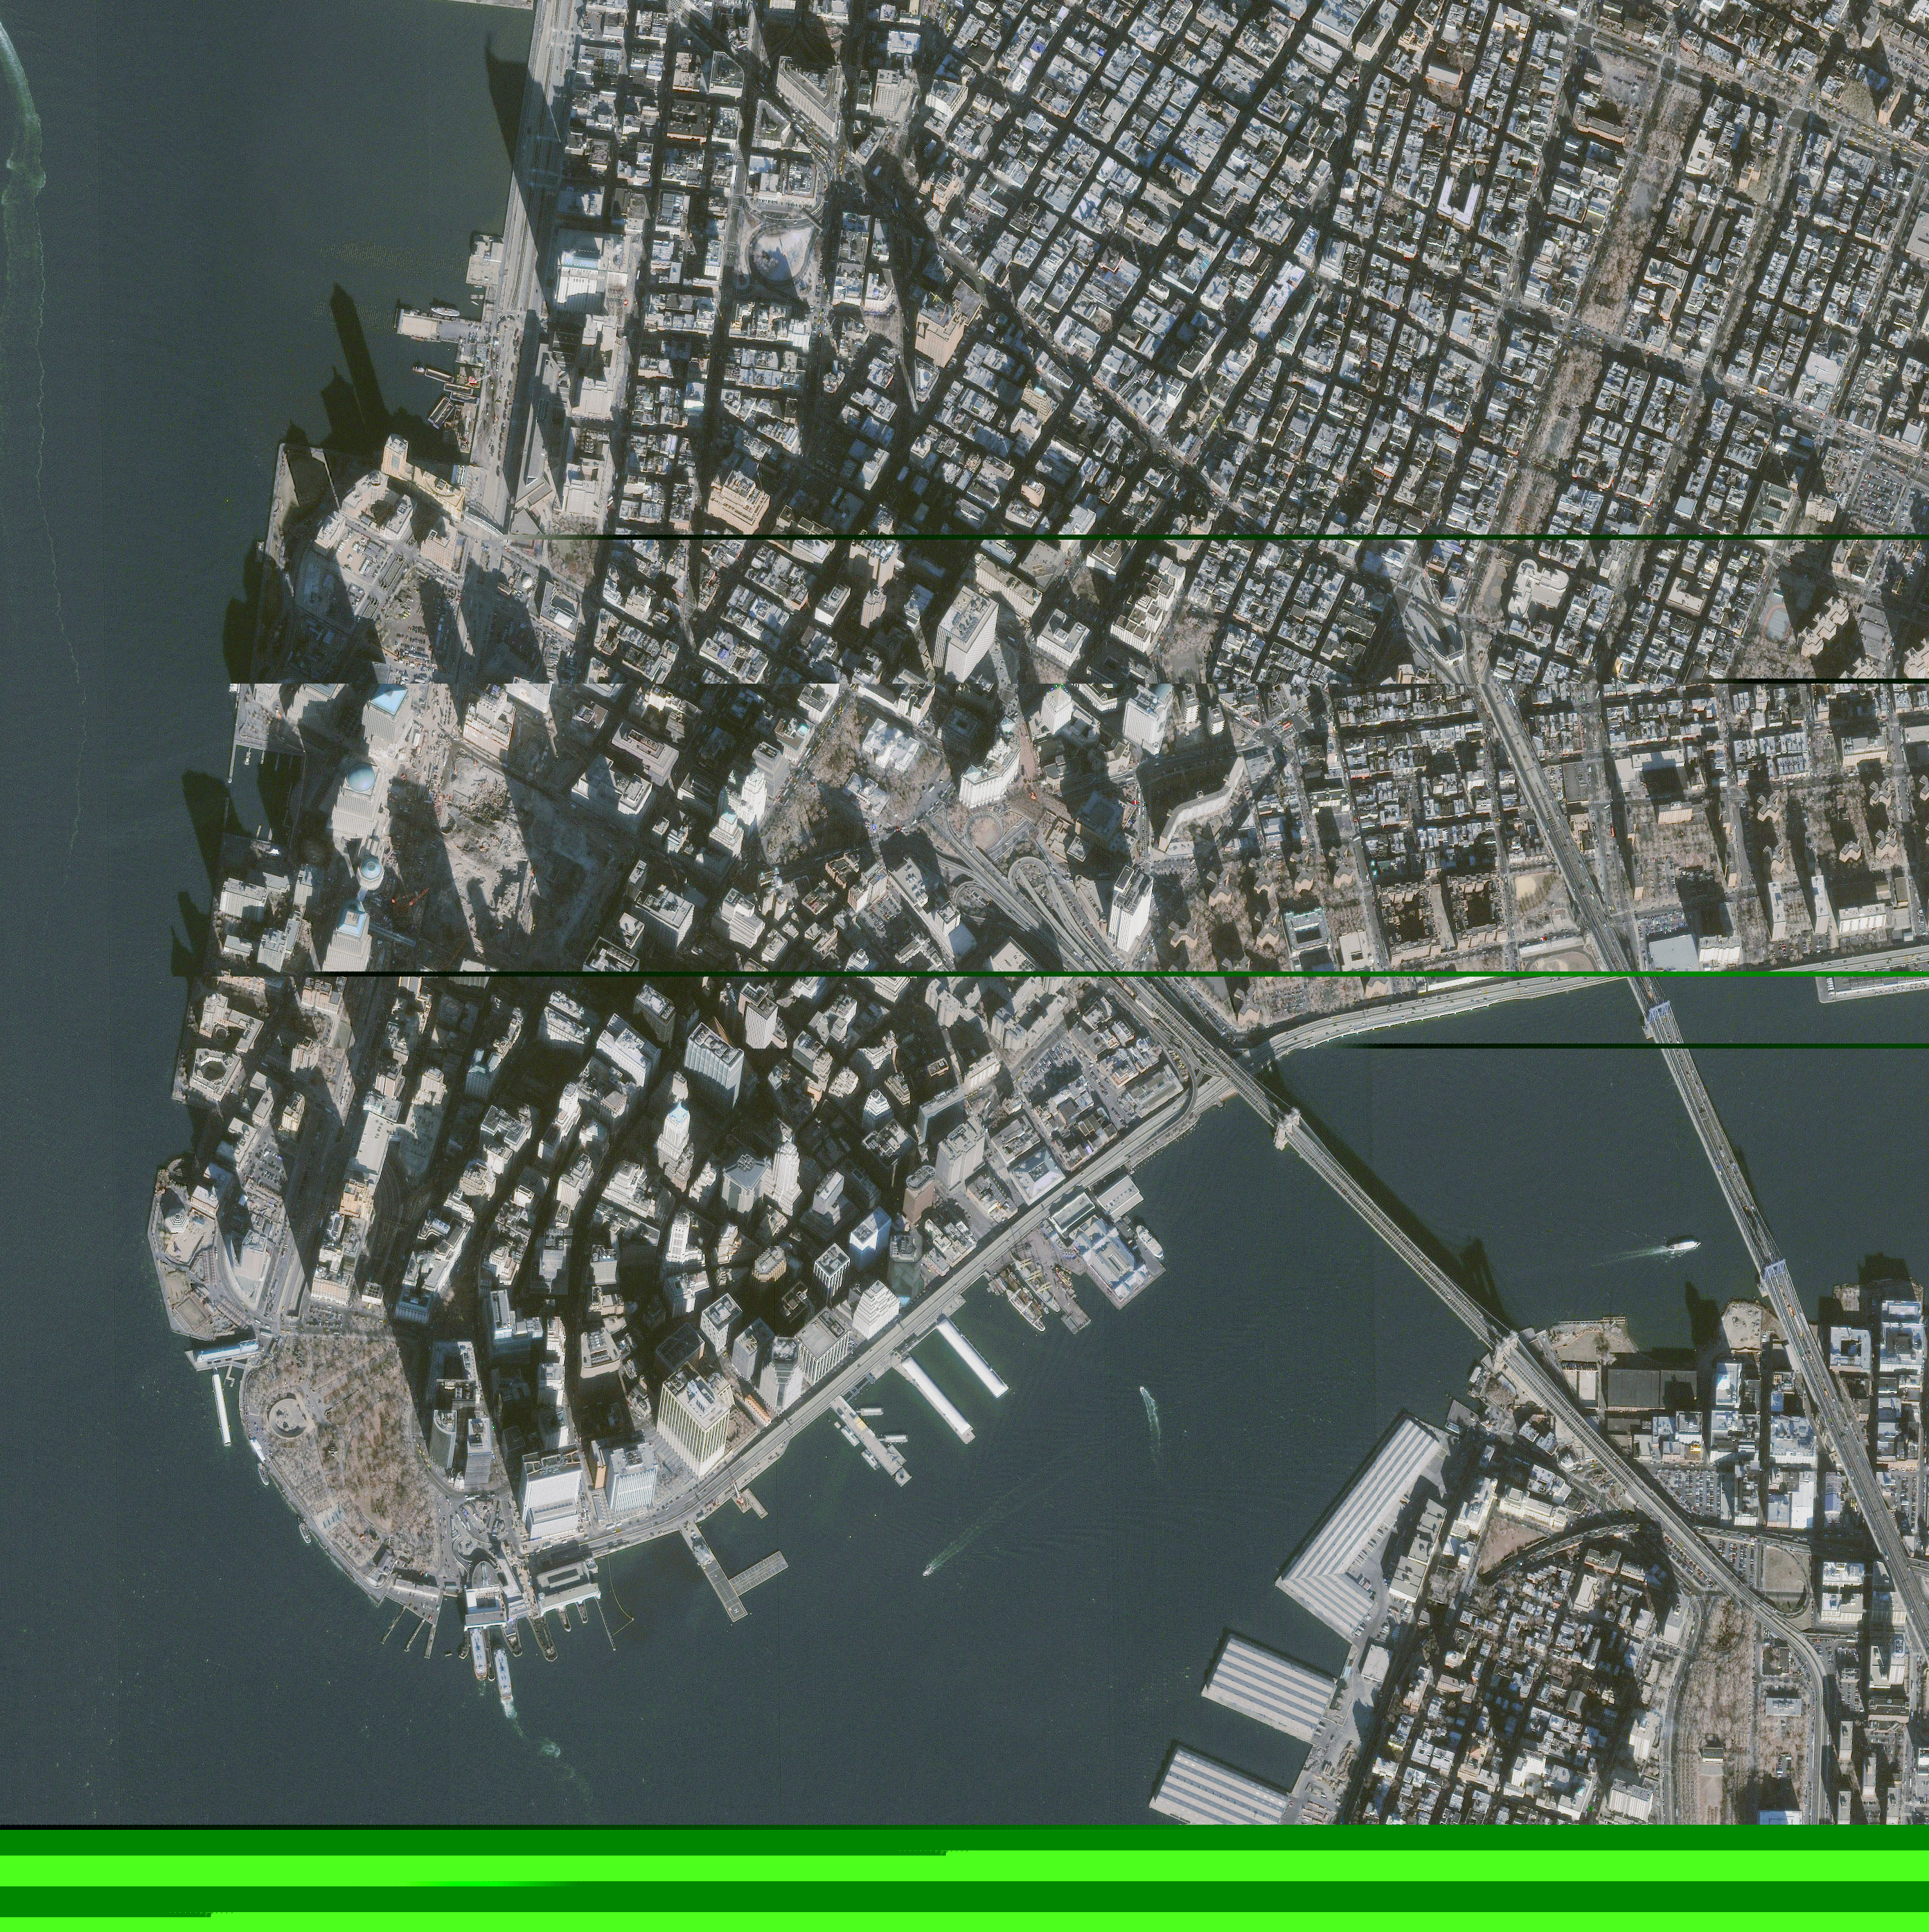
| Figure 17. (9/12?/01) Source: (higher resolution) |
Figure 18. Lower-left portion of previous image. The fuming is becoming translucent. |
| September 12?, 2001 (9/12/01 or 9/13/01?) |
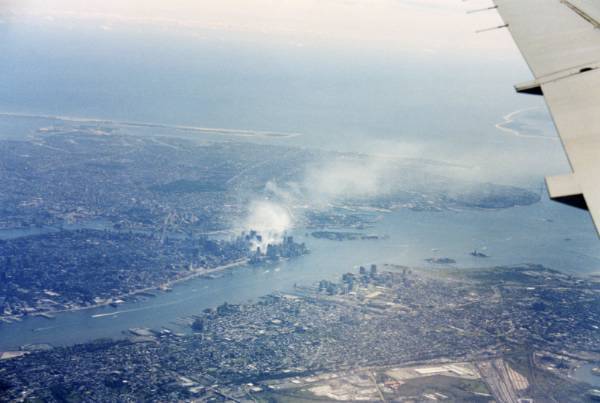 |
| Figure 19. Boiling a pot of water on the stove doesn't fill a kitchen with steam. If the flight 93 story were true, a view similar to the image above would be anticipated for the passengers on the left side of the plane. This flight was reported to have taken off from the Newark Airport at 8:42 AM and the WTC1 event was reported to have occurred at 8:46:26 AM. In essence, the passengers on "flight 93" would have had a front-seat view of the event. (9/12?/01) Source: |
| For a simple calculation, assume this plane has traveled about 20 miles since its wheels left the ground, and assume it's averate speed since taking off is 200 mph. (20 miles)/(200 miles/hr.)*(60 min./hr.) = 6 min. |
20*60/200 = 6 minutes. 20 miles at 200 mph = 6 minutes 20 miles at 240 mph = 5 minutes 16 miles at 240 mph = 4 minutes. |
|
click on images for enlargements.
|
| September 13, 2001 (?) |
September 13, 2001 (?) |
 |
 |
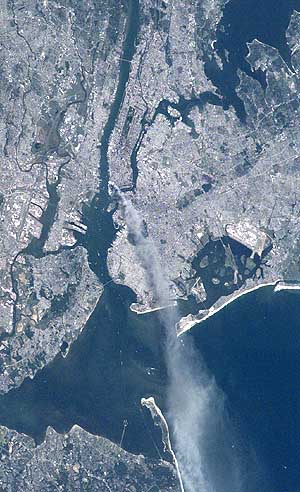
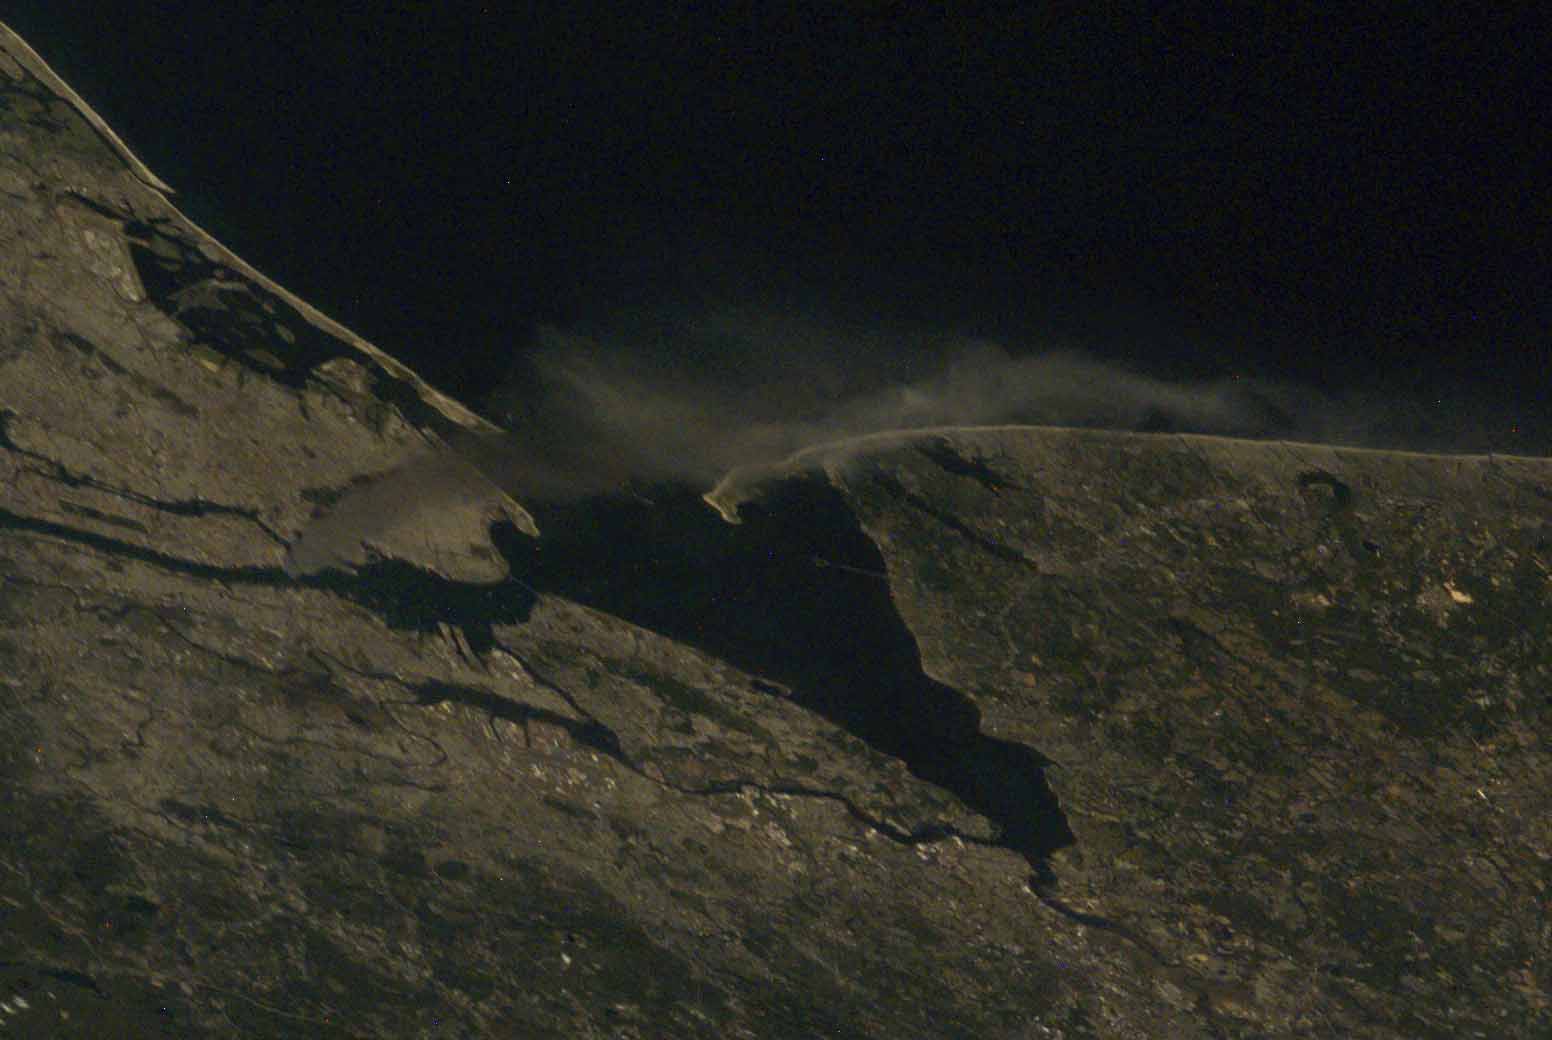
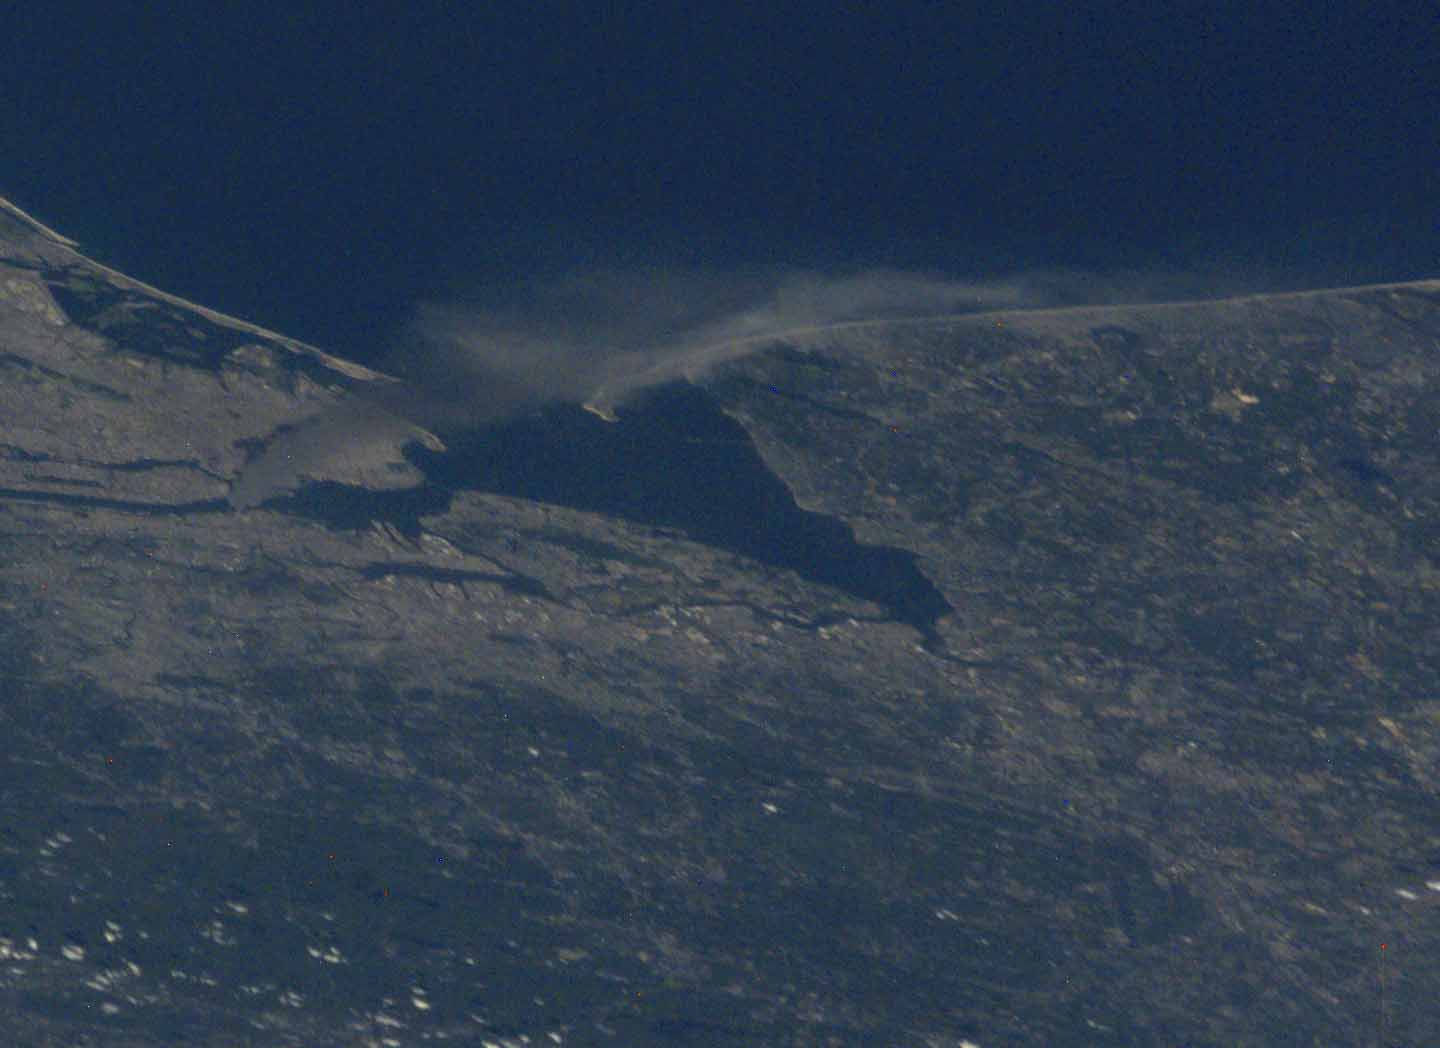
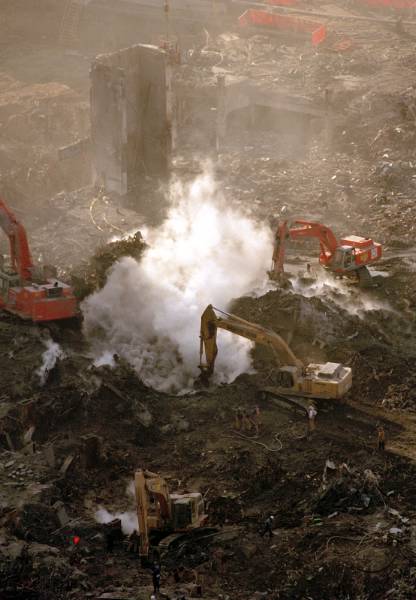
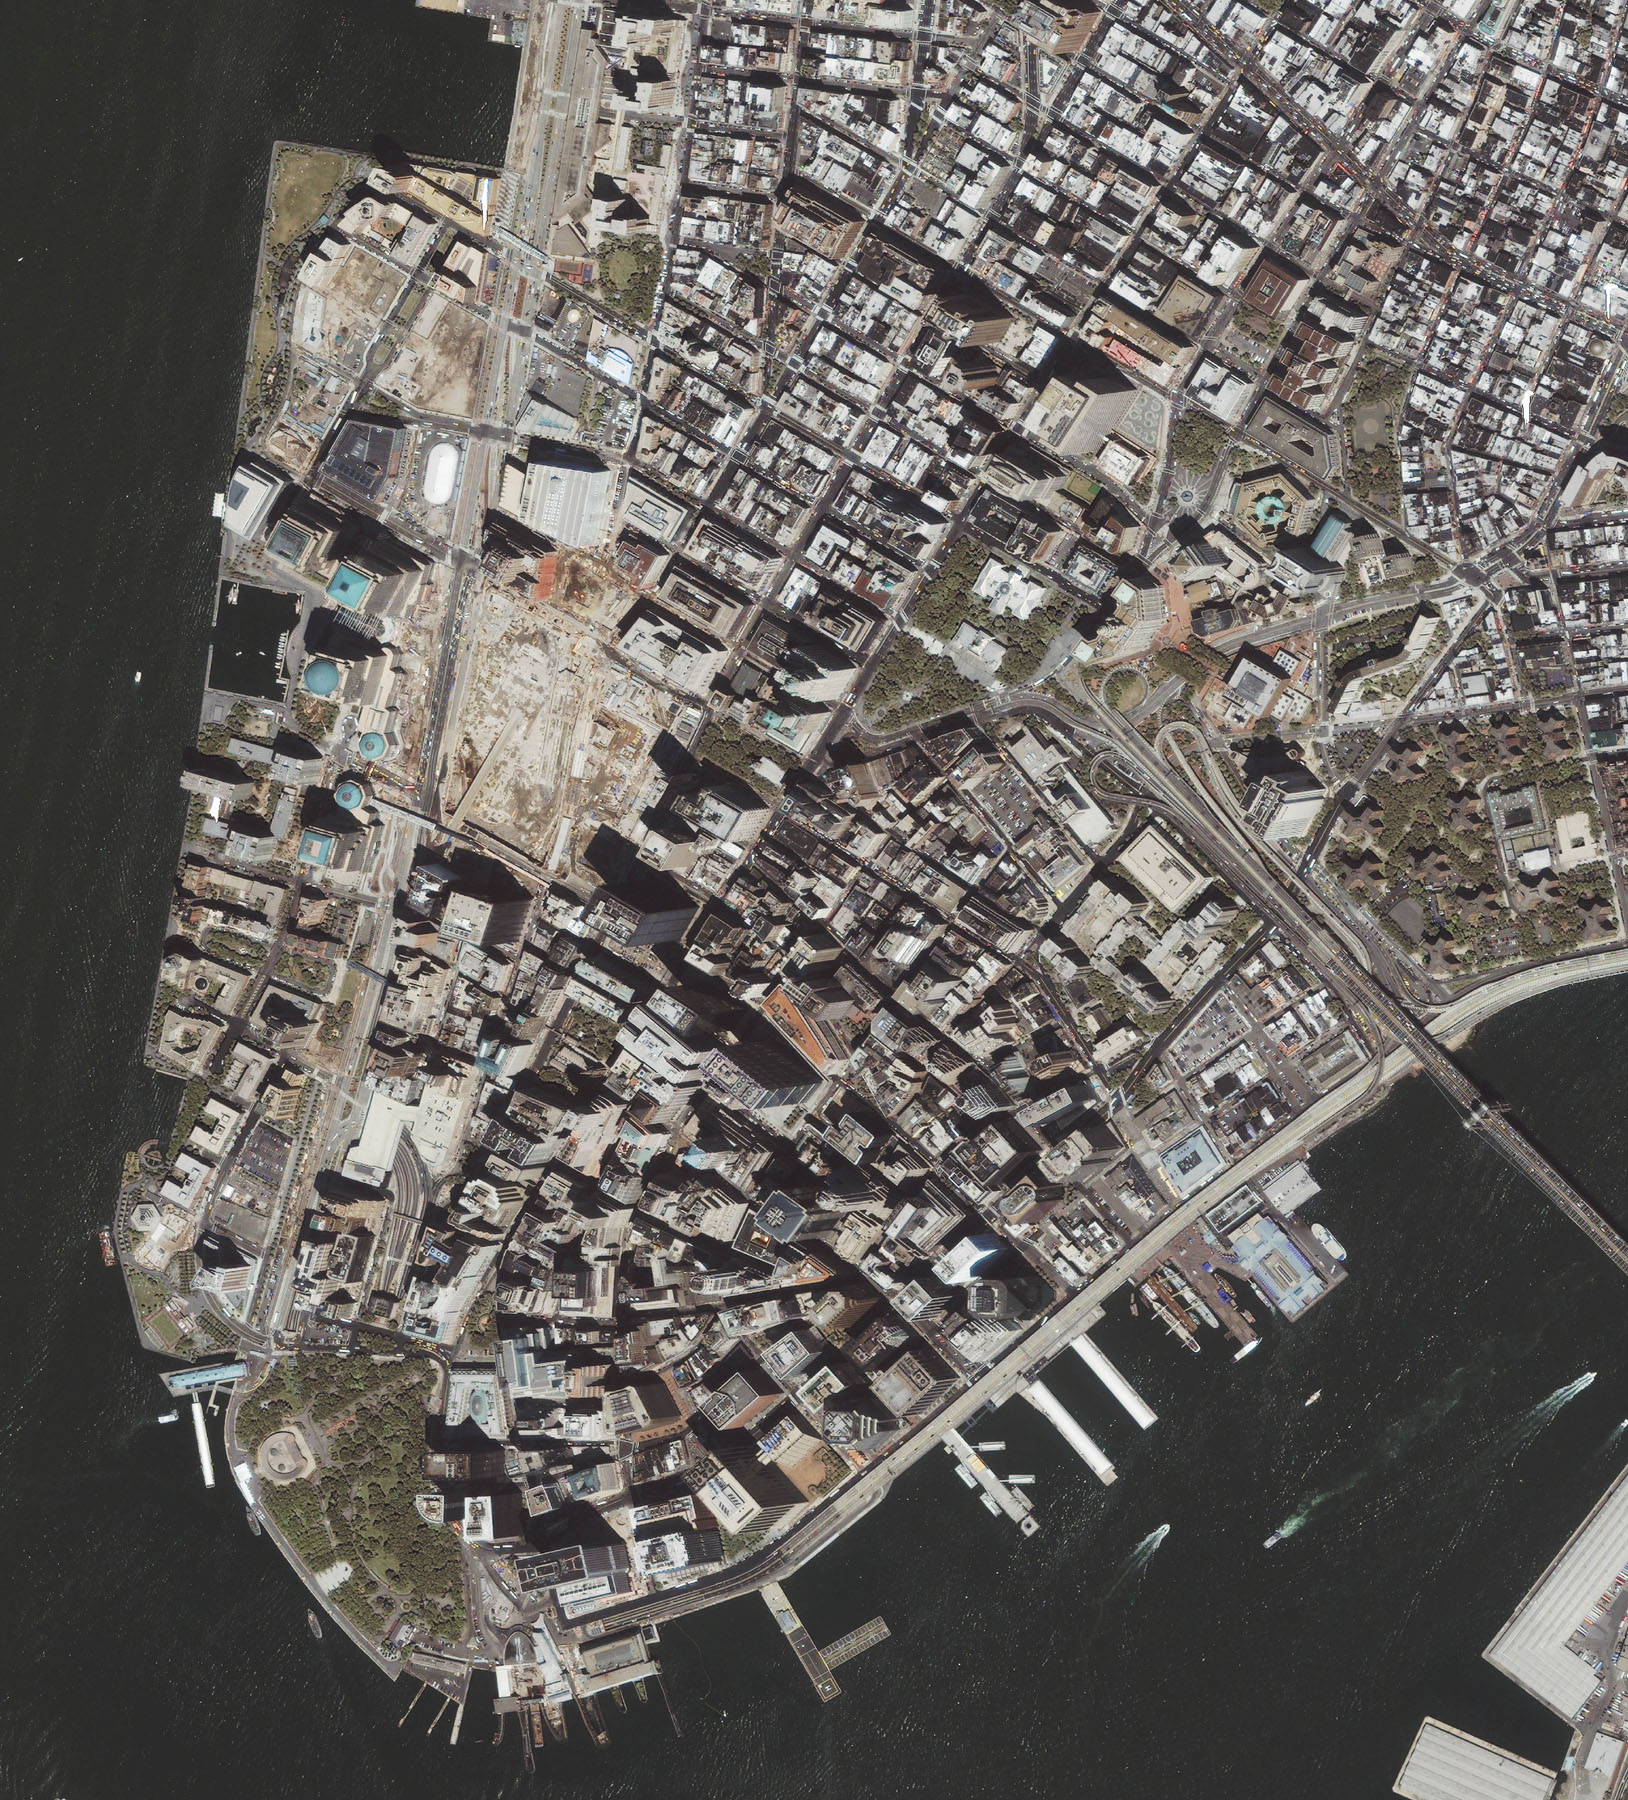
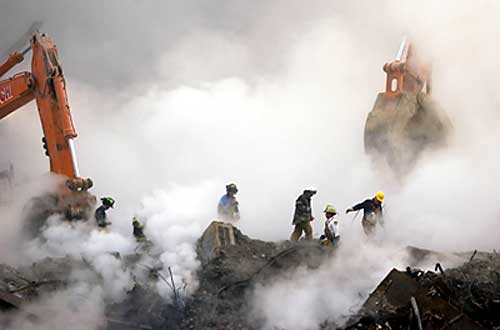
| Figure 20. What is in this cloud of fumes rising from the WTC site? (9/13?/01) Source: |
Figure 21. Photo taken from the International Space Station. (reference) (9/13/01) Source: wikipedia (however, it appears Wikepedia incorrectly stated it as 9/11/01), (9/13/01) Source: |
| September 13, 2001 |
|
|
| Figure 22. Photo taken from the International Space Station. (reference). The fuming appears translucent blue. (9/13/01) Source: wikipedia (however, it appears Wikepedia incorrectly stated it as 9/11/01), (9/13/01) Source: |
| It rained on 9/14/01, beginning in the early morning and throughout the day. It again rained on 9/20/01. |
| September 15, 2001 |
December 31, 2001 |
 |
 |
| Figure 24. The clouds look different than the fuming. (9/15/01) Source: |
Figure 25. (12/31/01) Source: |
| June 8, 2002 |
September 4, 2002 |
September 22, 2002 |
 |
 |
 |
| Figure 26. (6/8/02) Source: |
Figure 27. (9/4/02) Source: |
Figure 28. (1/22/02) Source: |
|
click on images for enlargements.
|
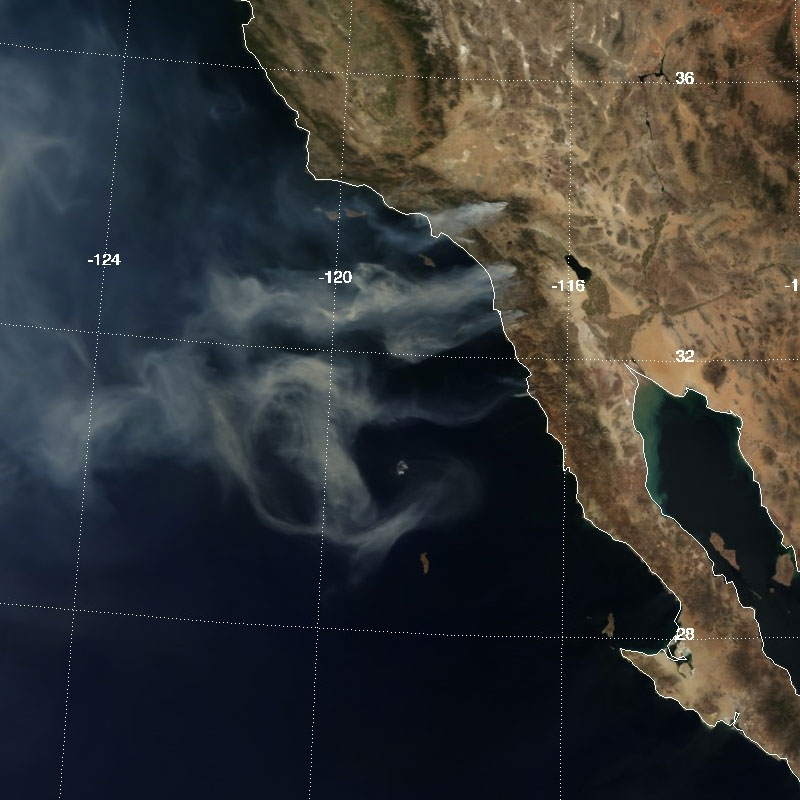 |
Figure 29. Record Breaking California Wildfires On October 23rd 2007, the Terra-MODIS instrument captured this image of multiple wildfires and smoke driven by powerful Santa Ana winds in southern California. The fires flared up over the previous weekend, when temperatures surged past 110 degrees in some parts of the state, creating tinder-like conditions in areas already starved of water by an unusually dry winter. The wildfires have forced nearly 1/2 a million people to evacuate their homes from San Diego to just north of Los Angeles. Image by Ridgway & Hubanks, NASA GSFC. More RGB images of MODIS granules can be found in the L1B Granules section. |
| September 11? 2001 |
September 12, 2001 (perhaps 9/11/01?) |
September 12, 2001 (perhaps 9/11/01?) |
September 13, 2001 (?) |
September 15, 2001 |
|
|
|
|
|
|
| Figure 30. (9/11?/01) Source: NewsdayPlume1.jpg |
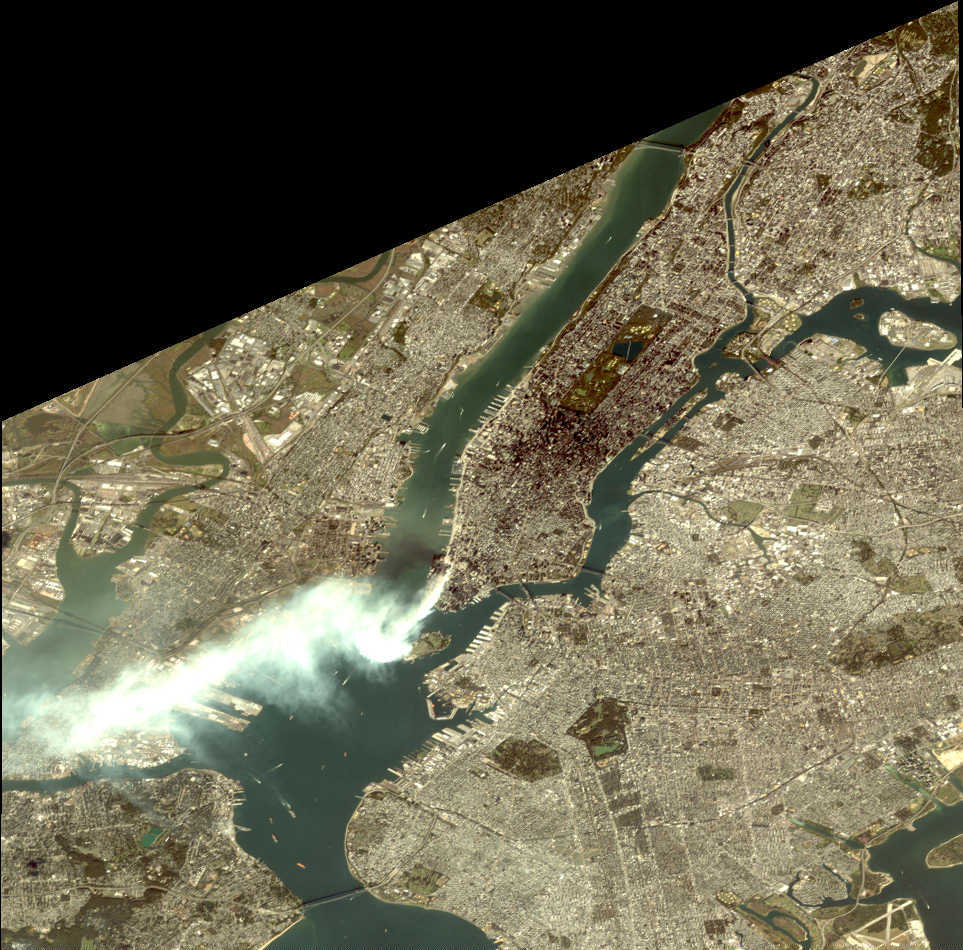
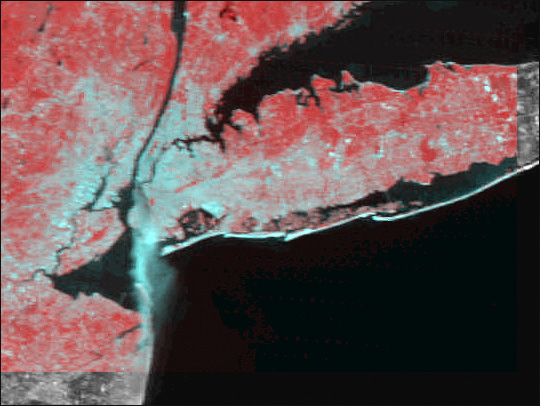
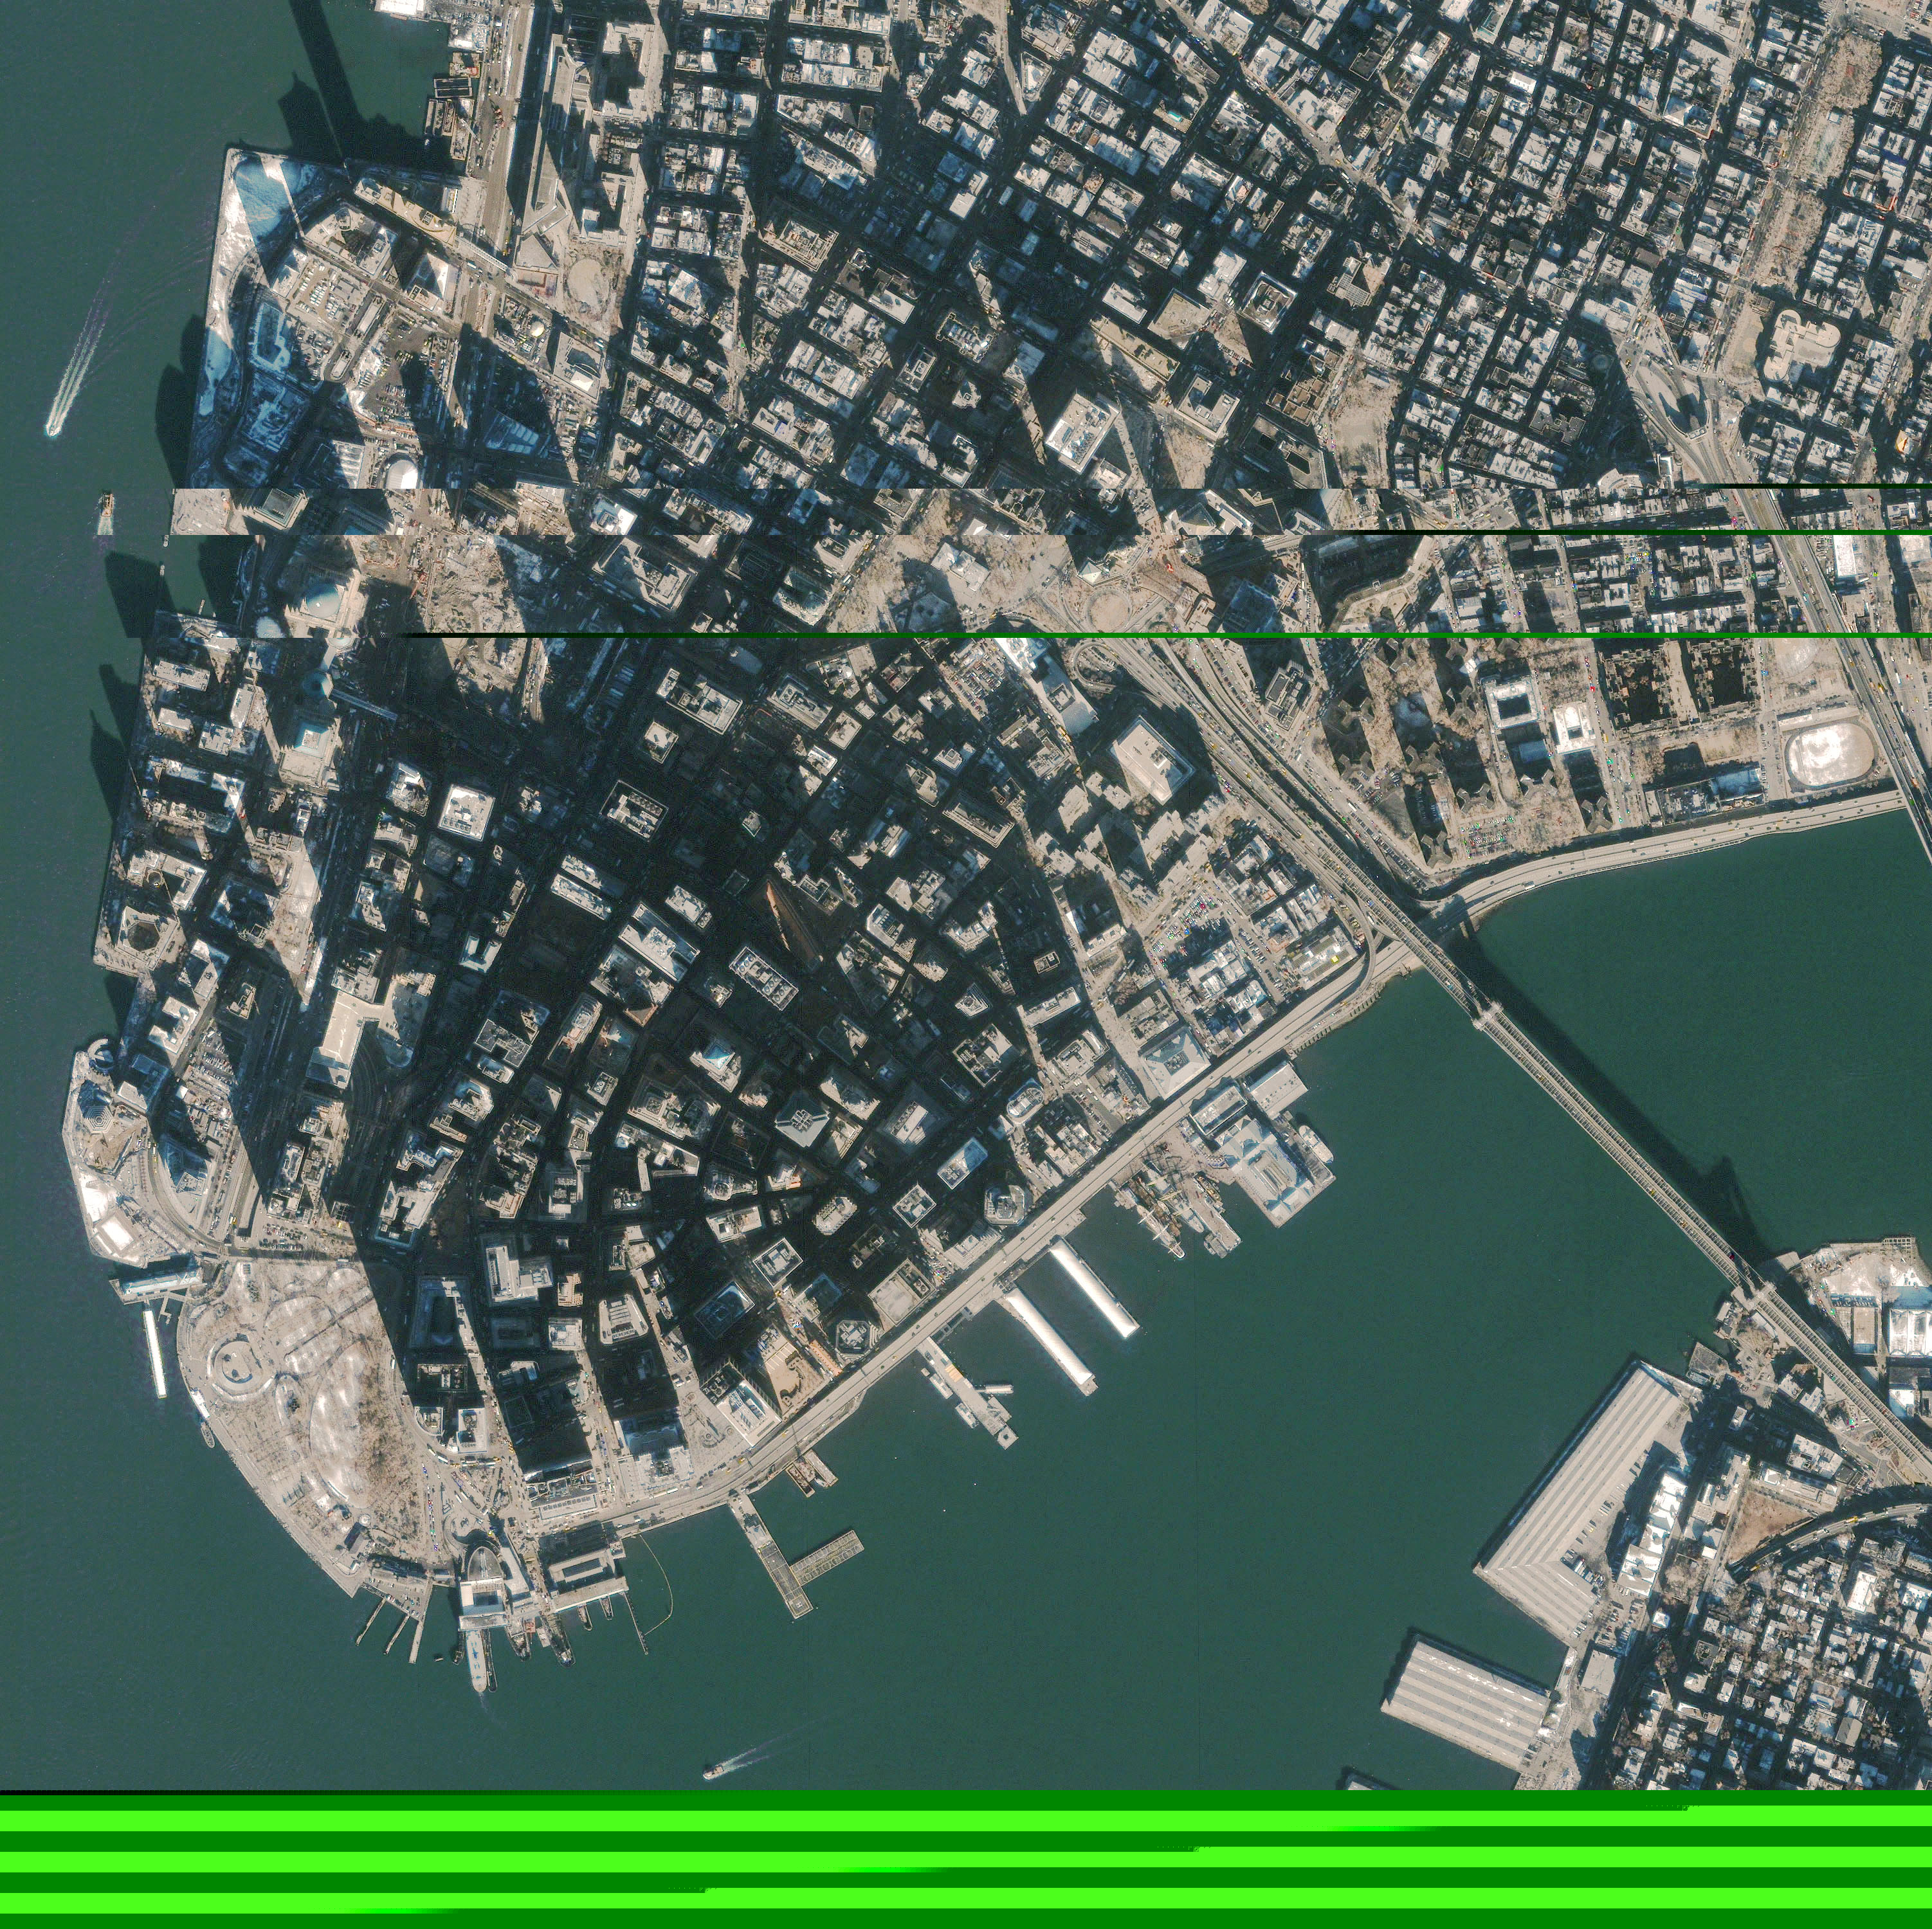
Figure 31. This satellite image was captured on 9/11/01 or 9/12/01. . (9/12/01) Source: space imaging: |
Figure 32. Lower-left portion of previous image. (9/12/01) Source: space imaging: browse.jpg |
Figure 33. View from the International Space Station. (Date is uncertain, but likely 9/13/01.) (9/12-13/01) Source: wikipedia , |
Figure 34. (9/15/01) Source: manhattan_9_15_01.jpg |
| August ??, 2007 |
2003 | |
|
|
 |
|
| Figure 35. California wild fires (8/07) Source: |
Figure 36. Influence of the Kuwait oil fires plume (1991) on the microphysical development of clouds, Yinon Rudich JOURNAL OF GEOPHYSICAL RESEARCH, VOL. 108, NO. D15, 4478, doi:10.1029/2003JD003472, 2003 Link to Journal of Geophysical Research (542x542) (?/?/?) Source: |
|
|
excerpt: "The smoke plume contained mostly soot aerosols with radius ranging between 0.015 and 35 mm and concentrations of up to 10 5 cm À3 [Hudson and Clarke, 1992; Parungo et al., 1992]. Typically, the ultrafine particles (0.003 mm < r <0.015 mm) concentration was 30% higher than that of the fine mode (0.015 mm < r < 0.3 mm) [Hudson and Clarke, 1992]. With increasing height and distance from the source, the concentration of the small and medium particles (0.06 < r < 0.6 mm) increased, while the coarse particles concentration (r > 0.5 mm) decreased, mainly because of sedimentation." (Reference provided by "who" and is greatly appreciated.) (1991) Source |
 |
| Figure 37. (10/31/01) Source |
|
click on images for enlargements.
|
 |
|
||
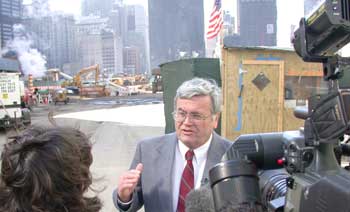
| Figure 38. At Ground Zero in New York City, UC Davis Professor Emeritus Thomas Cahill describes his air-quality findings to reporters on Feb. 23, 2002, just before testifying at an EPA investigative hearing in Manhattan. (Sylvia Wright/UC Davis News Service file photo) (2/23/02) Source: (study)(archived) |
|||
|
|||
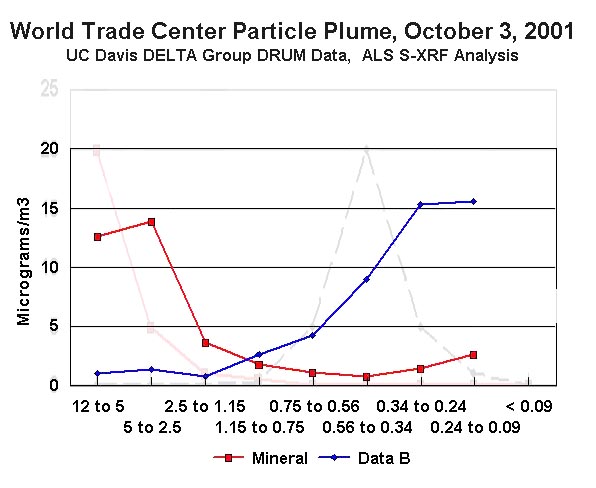
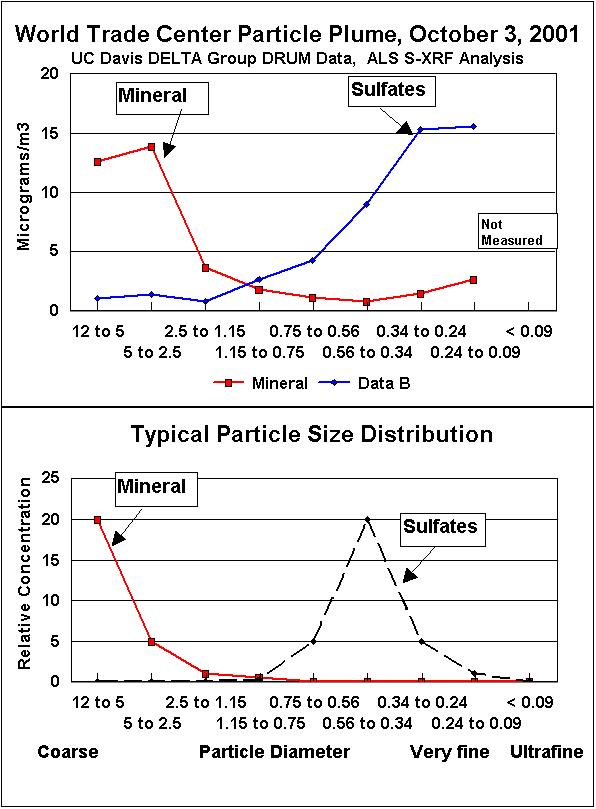
| Figure 39. Source: |
| Excerpts from Dr. Thomas Cahill's website, where the data is presented. |
|
"The new work helps explain the very fine particles and extraordinarily high concentrations found by an earlier UC Davis study, the first to identify very fine metallic aerosols in unprecedented amounts from Ground Zero. It will be essential to understanding the growing record of health problems." ....... "The new study also confirms, Cahill said, that the very fine particles observed were almost totally from the trade center debris pile and not from other upwind sources, such as power plants and the diesel trucks used to haul away the debris. |
| Reference 1. "Trade Center Debris Pile Was a Chemical Factory, Says New Study," September 10, 2003 (9/10/03) Source: (archived)[Emphasis added.] |
| Reference Sites |
|
Erin 2001 wind analyses
http://www.aoml.noaa.gov/hrd/Storm_pages/erin2001/wind.html, (archived) Background on the HRD Surface Wind Analysis System http://www.aoml.noaa.gov/hrd/Storm_pages/surf_background.html, (archived) Hurricane Erin 2001 http://www.aoml.noaa.gov/hrd/Storm_pages/erin2001/, (archived) NASA Makes A Heated 3-D Look Into Hurricane Erin's Eye http://www.sciencedaily.com/releases/2005/10/051007090048.htm, (archived) Images and Data from Terra http://terra.nasa.gov/Gallery/ Images http://modis-atmos.gsfc.nasa.gov/IMAGES/index.html , (archived) |
|
Continue to next page.
|
| Top | homepage |
|
|
|
|
|
|
|
|
|
